Breeding potential of cultivated lentil for increased protein and amino acid concentrations in the Northern Great Plains
Crop Science. (2025) 65(3): e70085.
which is follow-up to:
&
- Derek M. Wright, Sandesh Neupane, Taryn Heidecker, Teketel A. Haile, Crystal Chan, Clarice J. Coyne, Rebecca J. McGee, Sripada Udupa, Fatima Henkrar, Eleonora Barilli, Diego Rubiales, Tania Gioia, Giuseppina Logozzo, Stefania Marzario, Reena Mehra, Ashutosh Sarker, Rajeev Dhakal, Babul Anwar, Debashish Sarker, Albert Vandenberg & Kirstin E. Bett. Understanding photothermal interactions can help expand production range and increase genetic diversity of lentil (Lens culinaris Medik.). Plants, People, Planet. (2020) 3(2): 171-181. doi.org/10.1002/ppp3.10158
- https://github.com/derekmichaelwright/AGILE_LDP_Phenology
Contents
Collaborators
- Department of Plant Sciences and Crop Development Centre, University of Saskatchewan, Saskatoon, Saskatchewan, Canada
- Department of Food and Human Nutritional Sciences, Faculty of Agriculture and Food Science, University of Manitoba, Winnipeg, MB, Canada
Figures
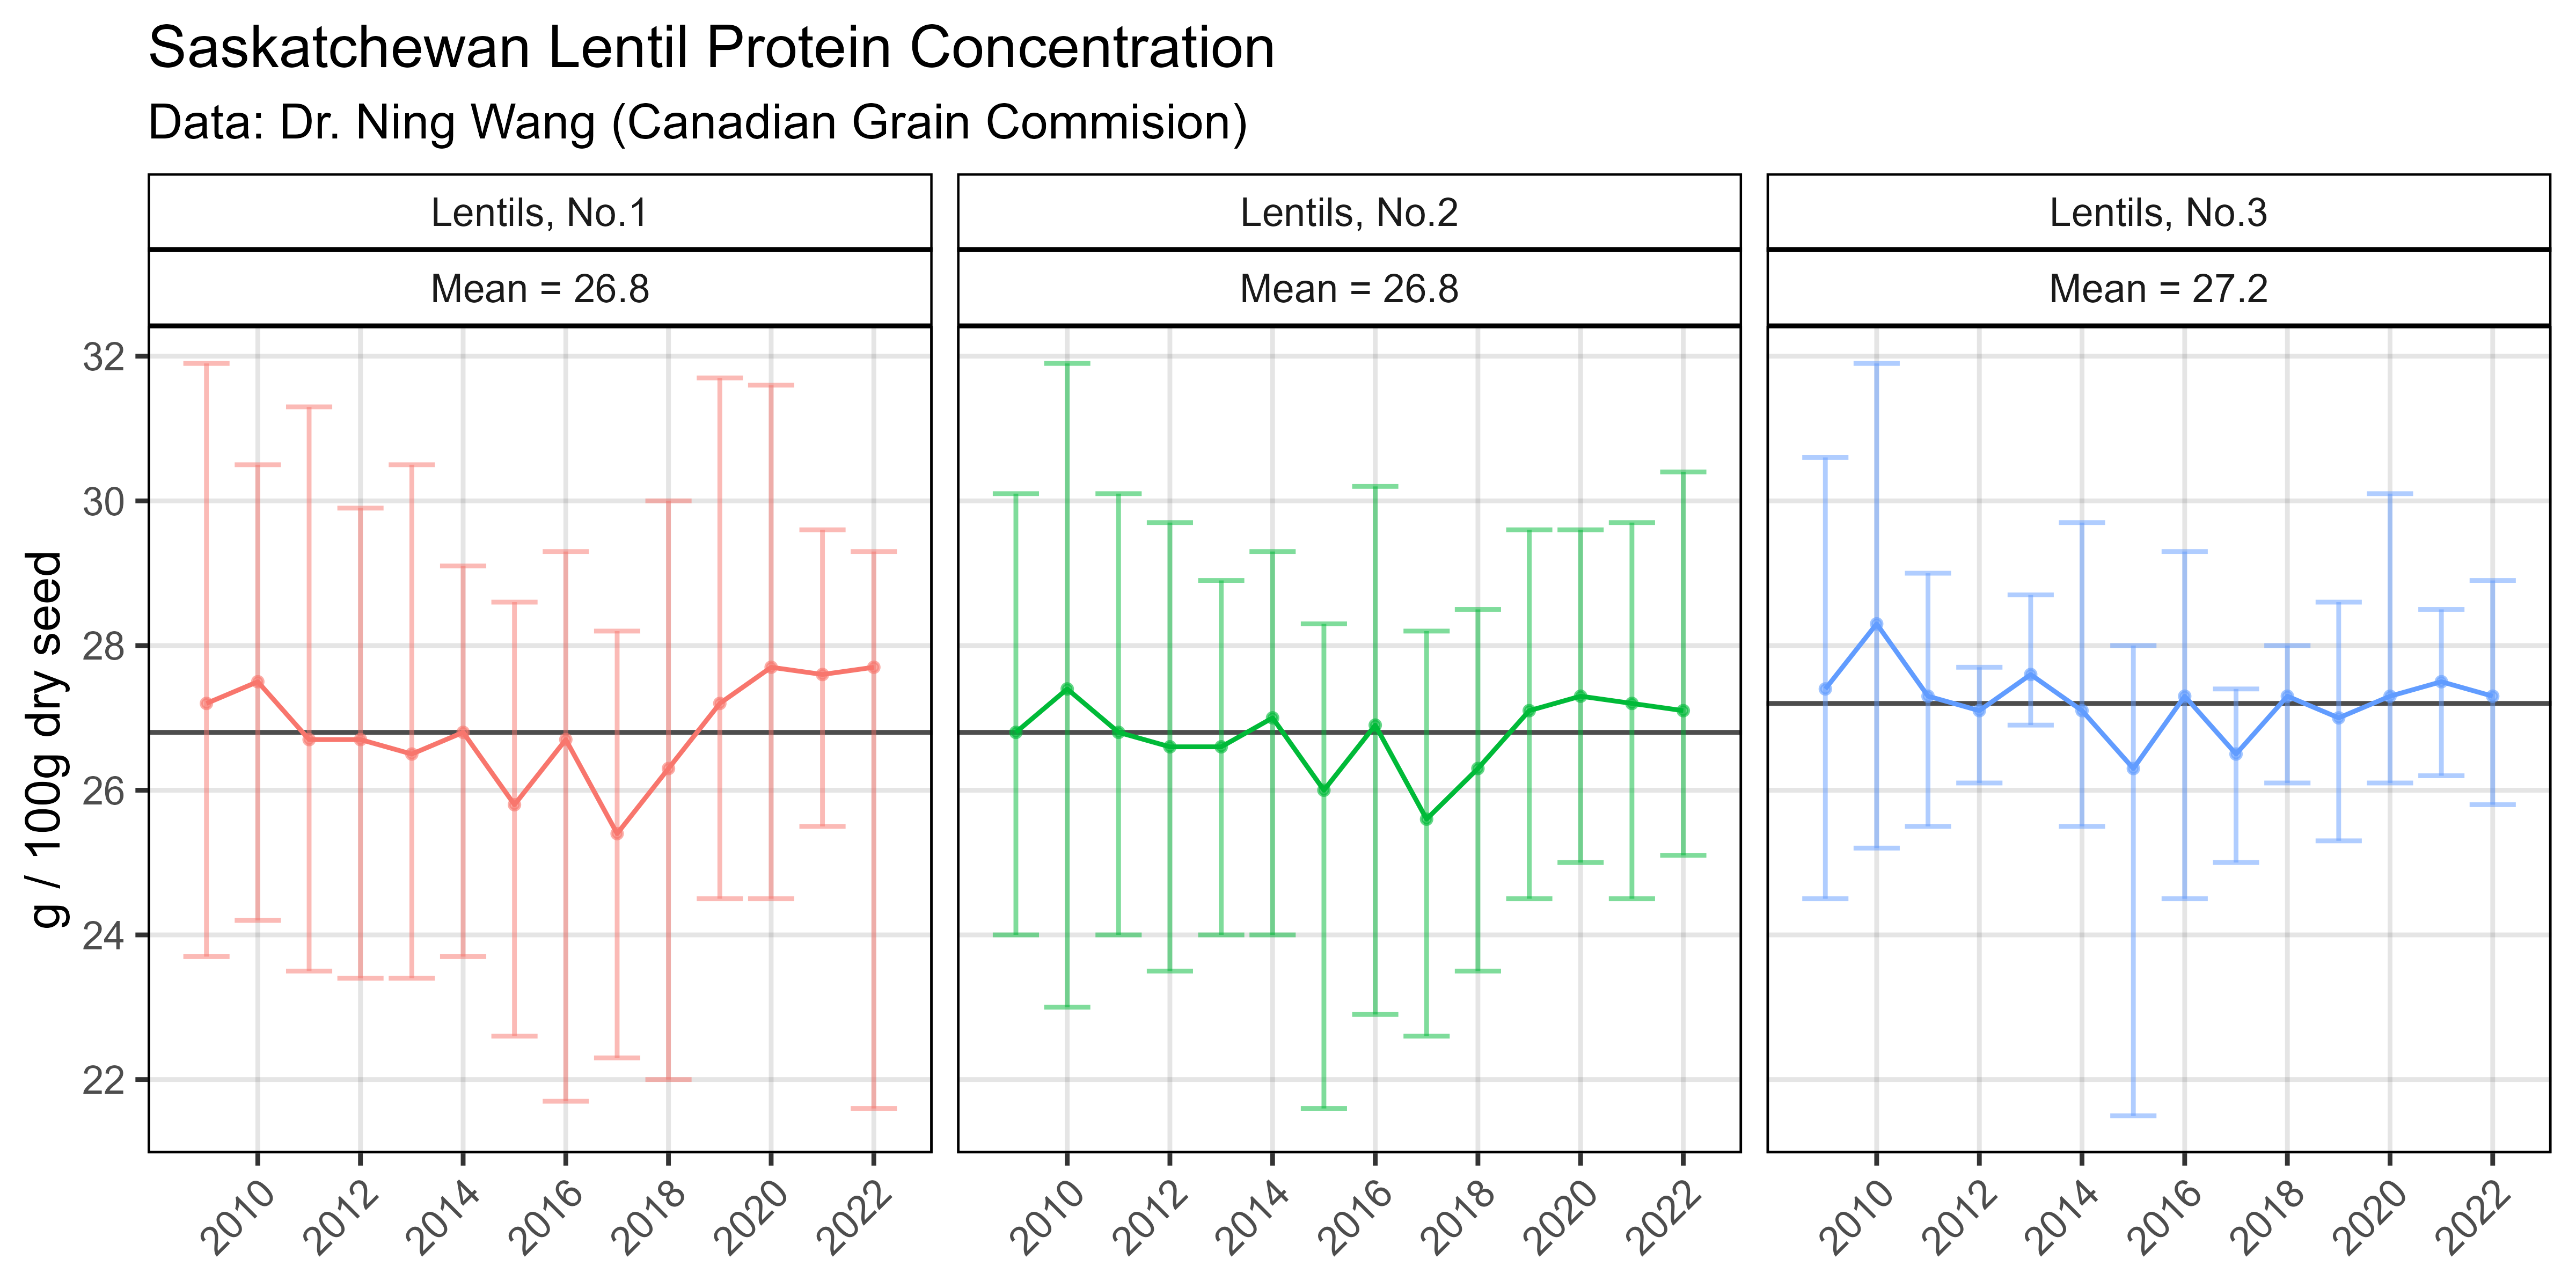
Figure 1
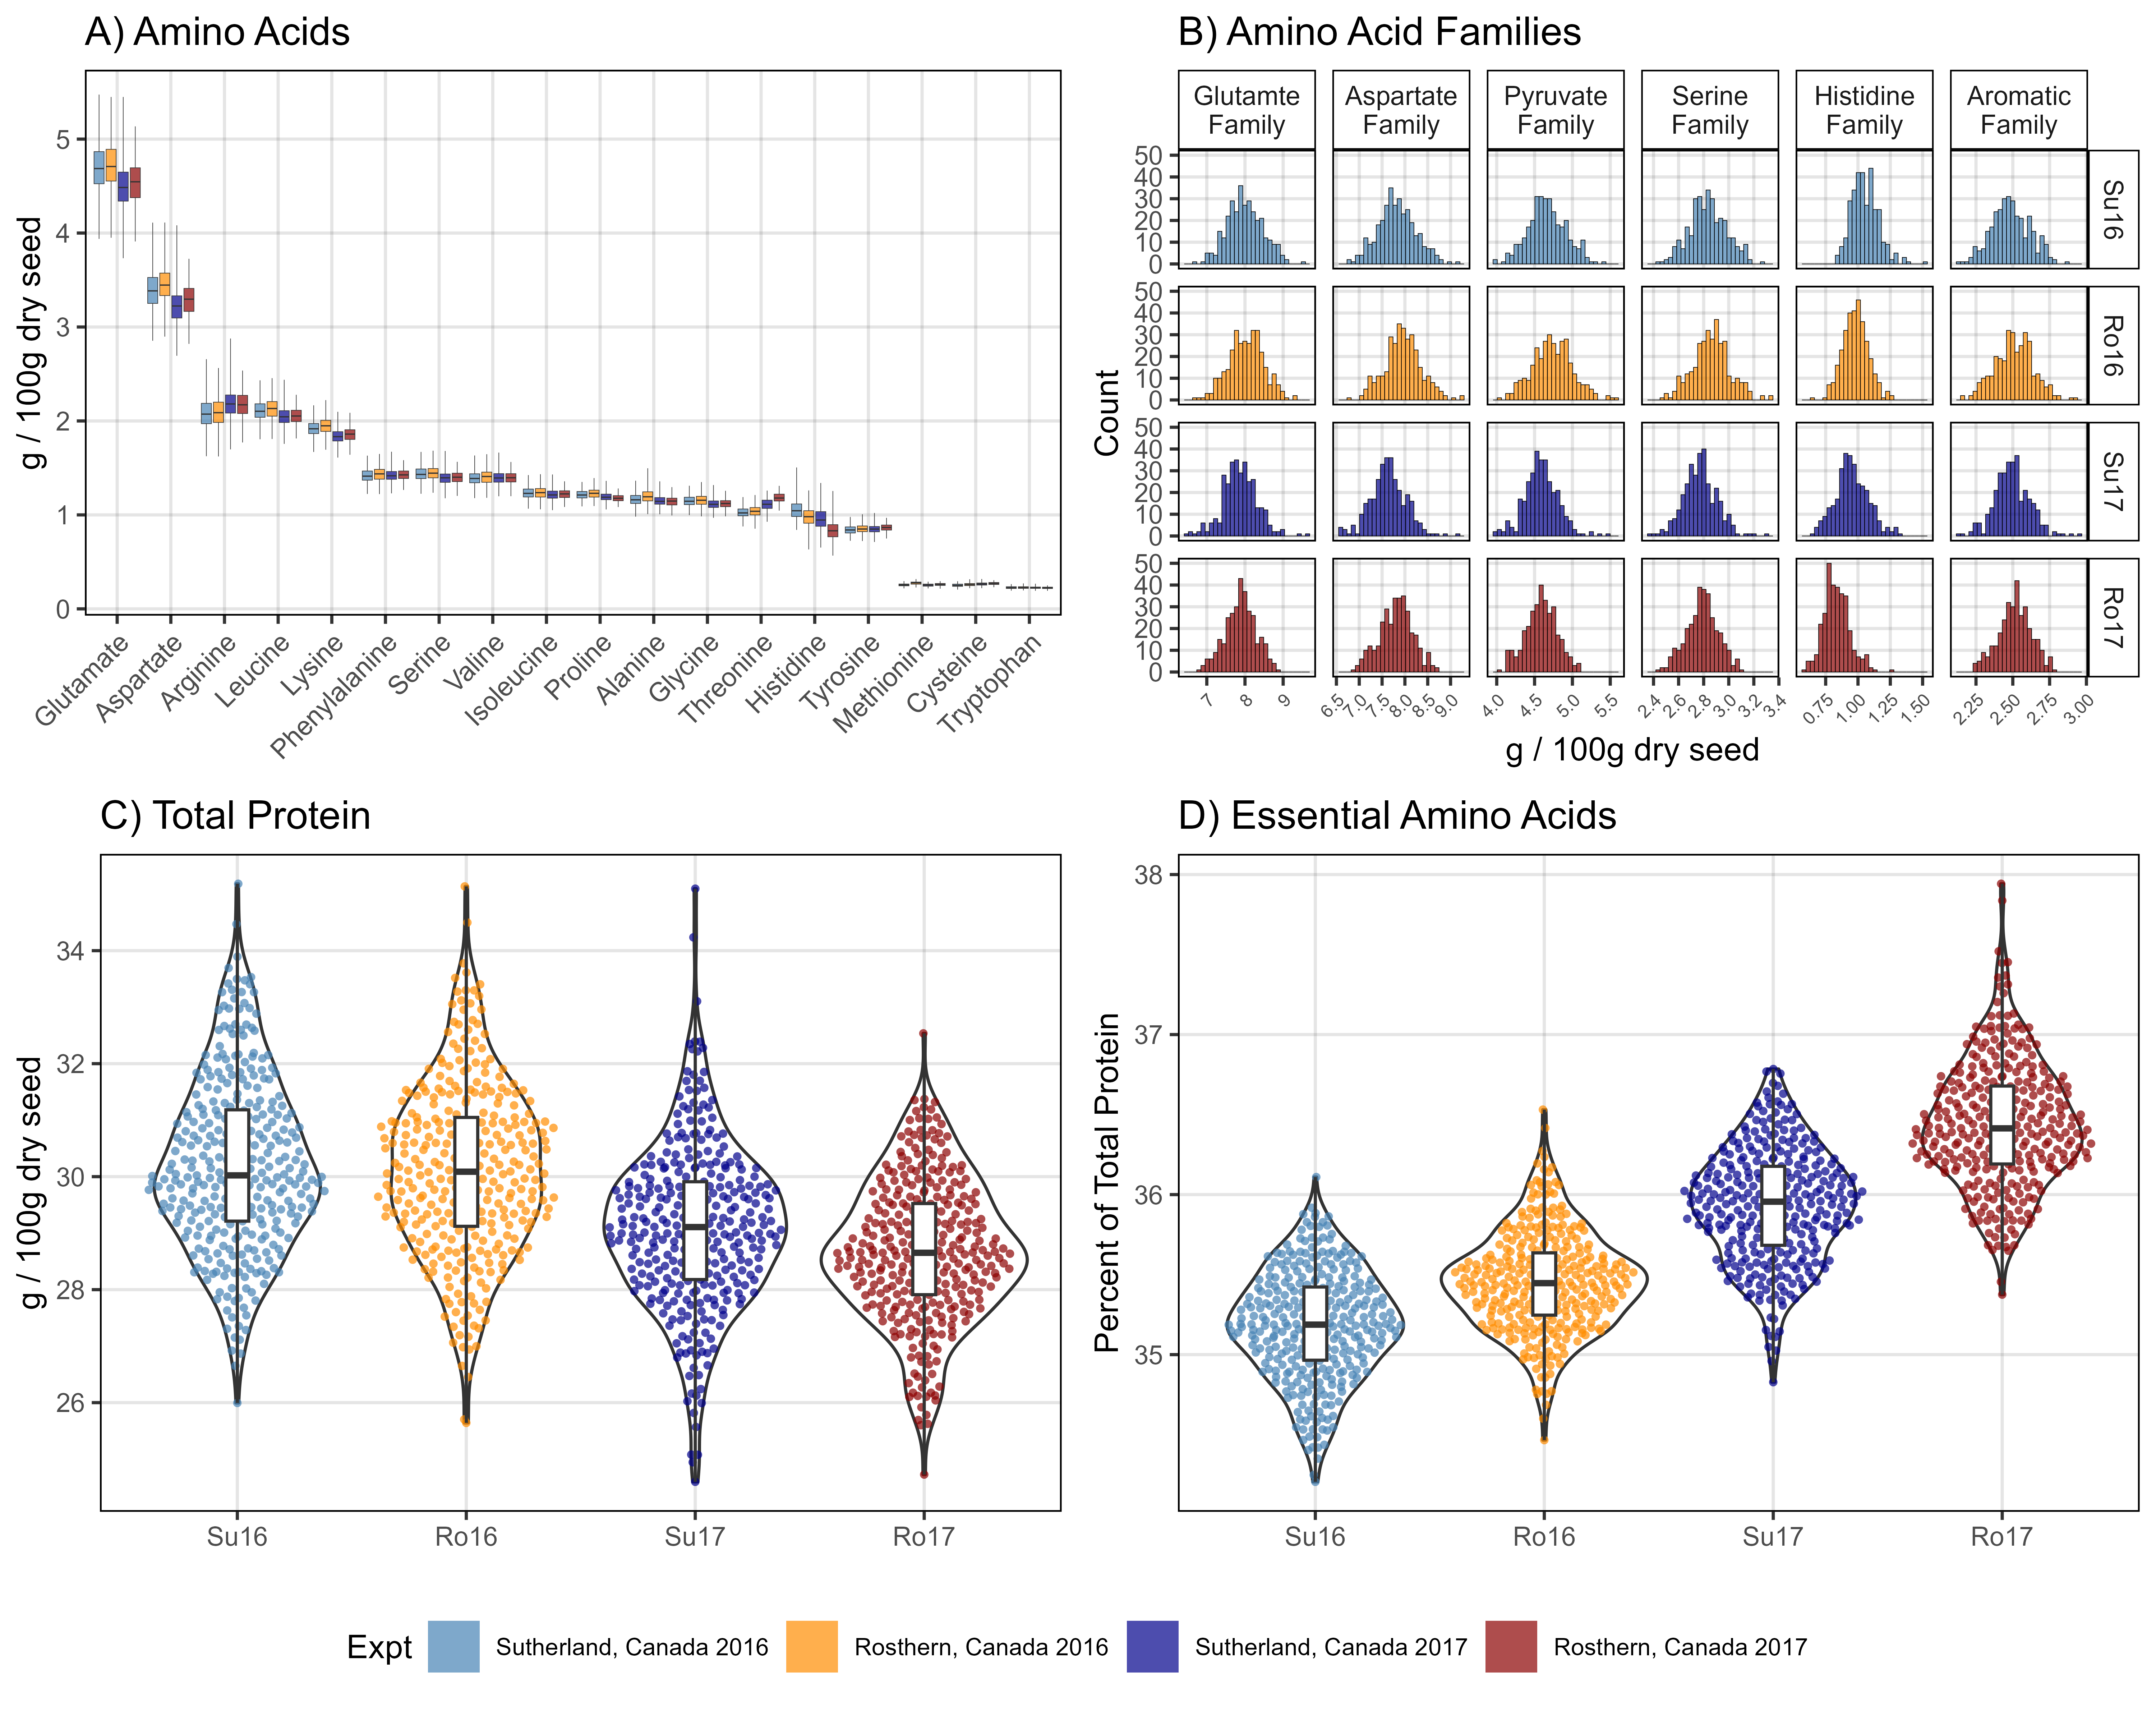
Figure 2
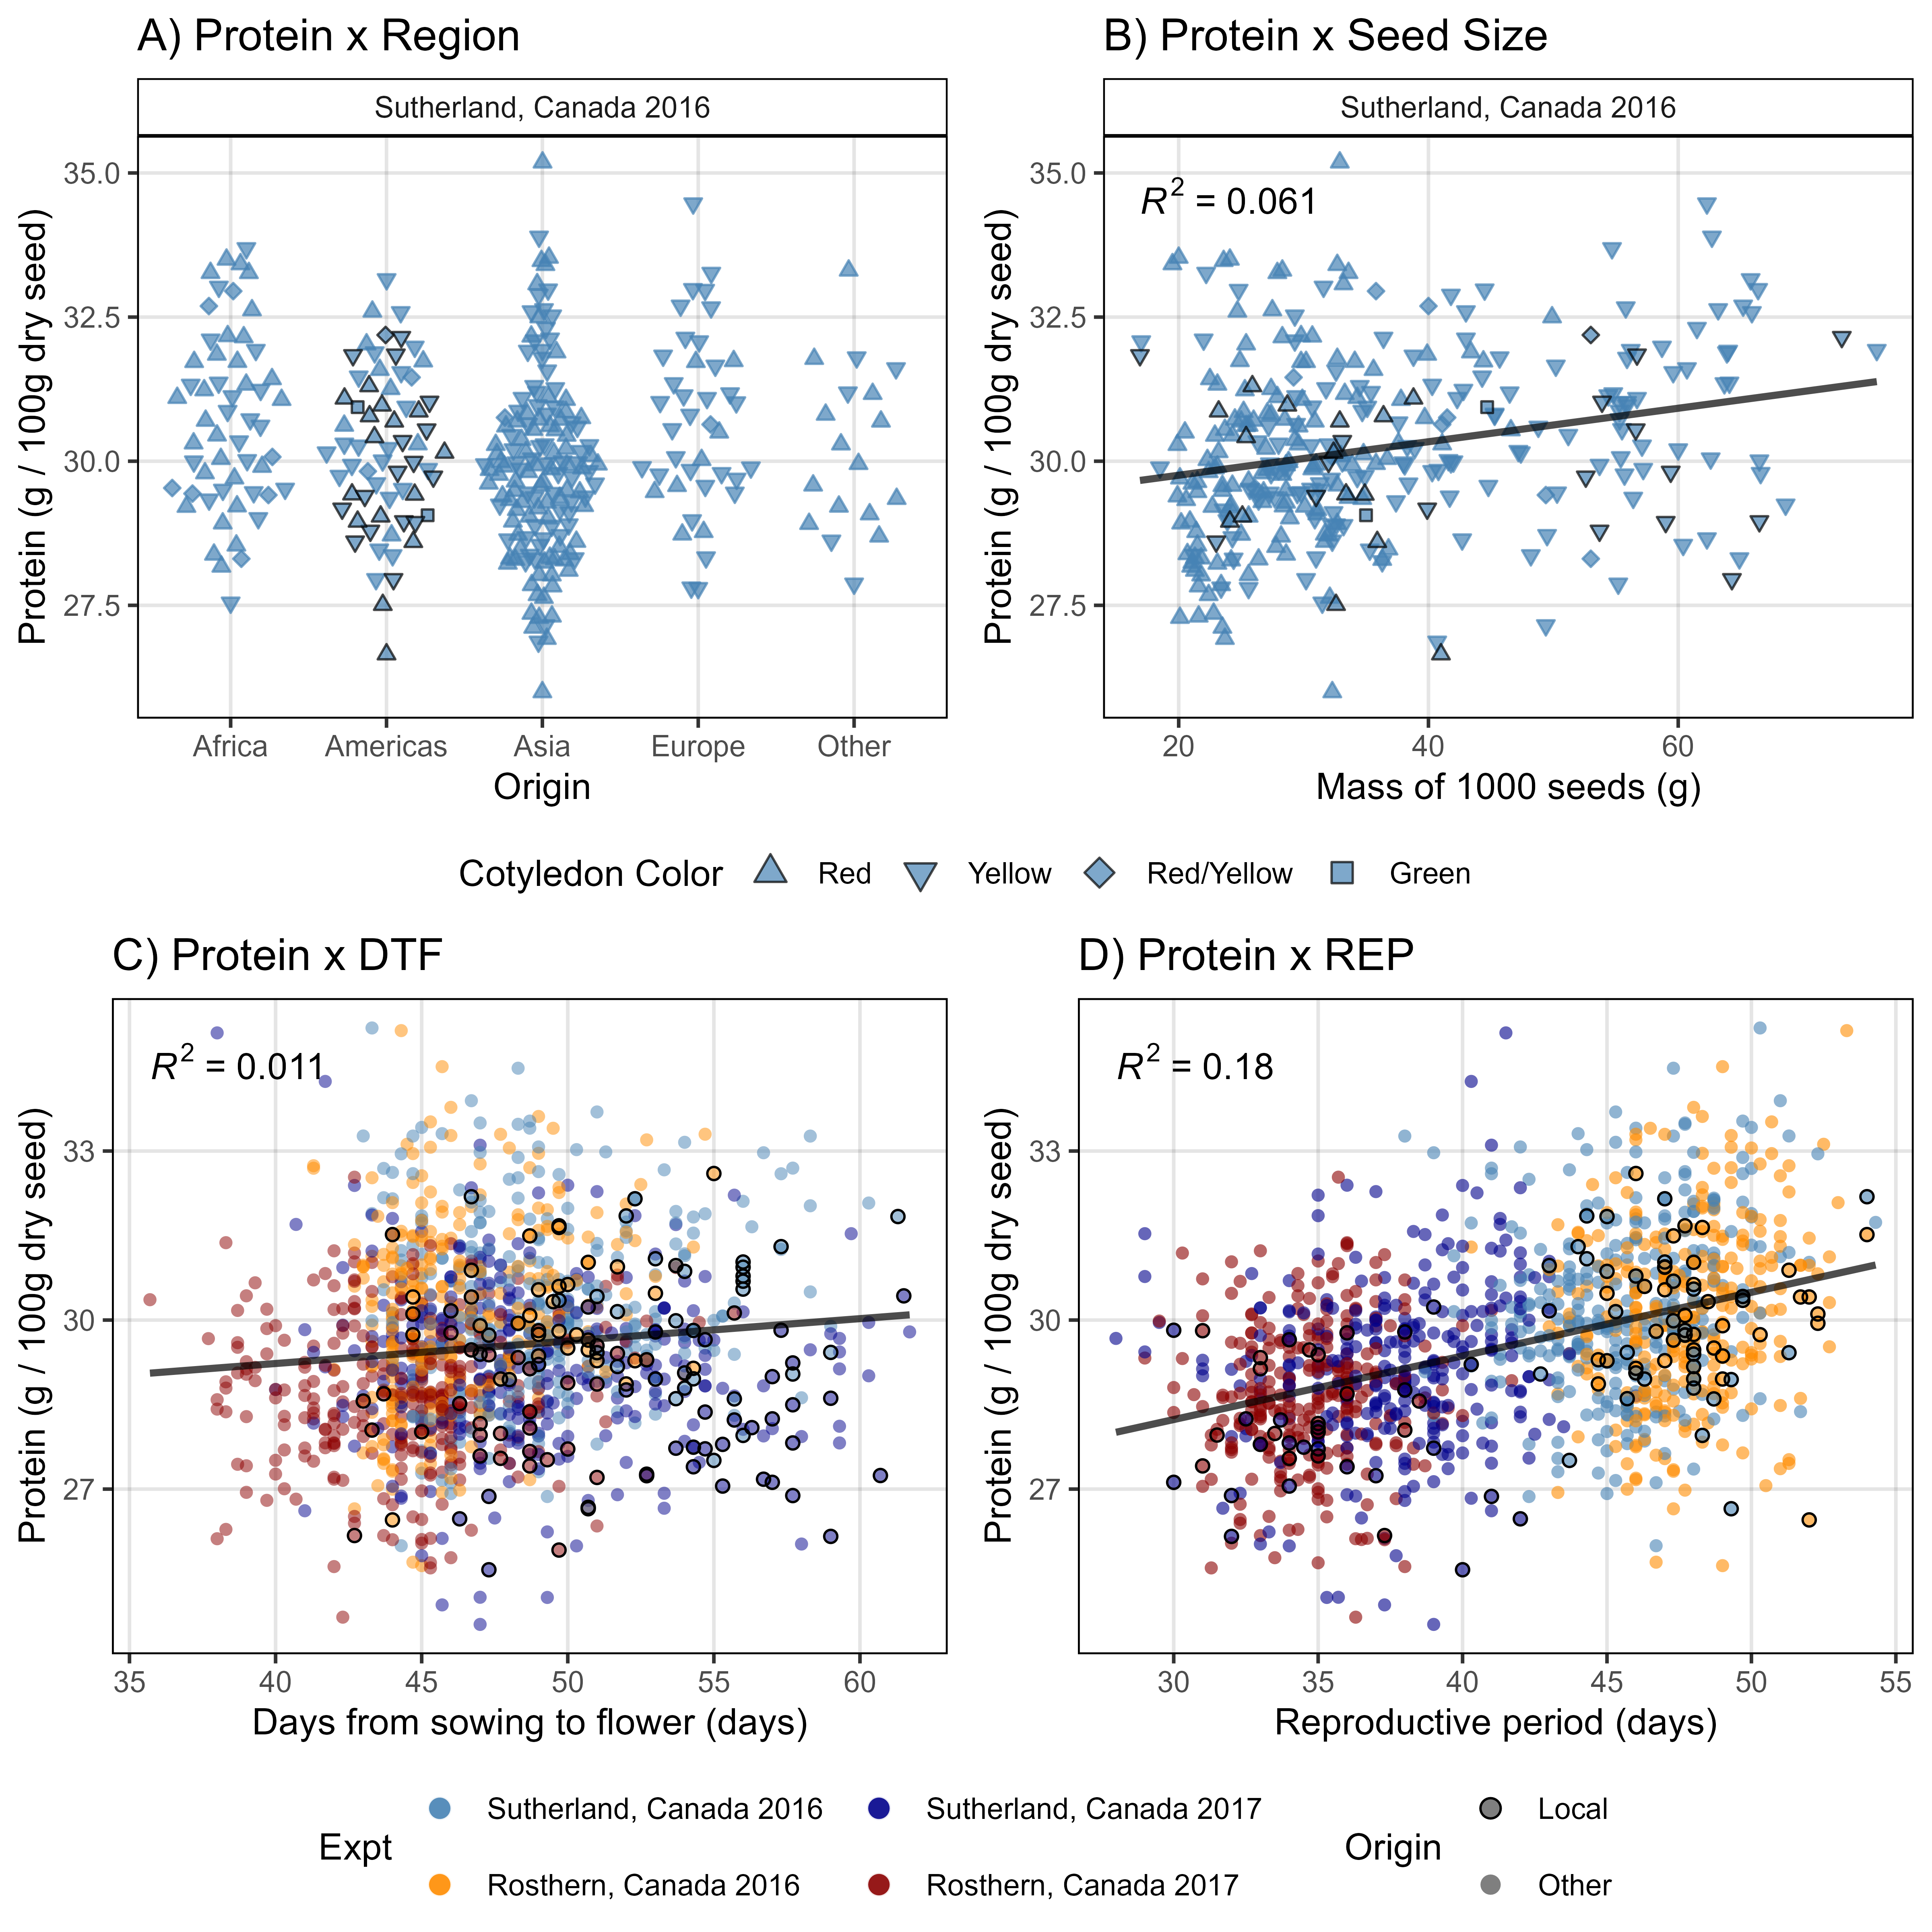
Figure 3

Figure 4
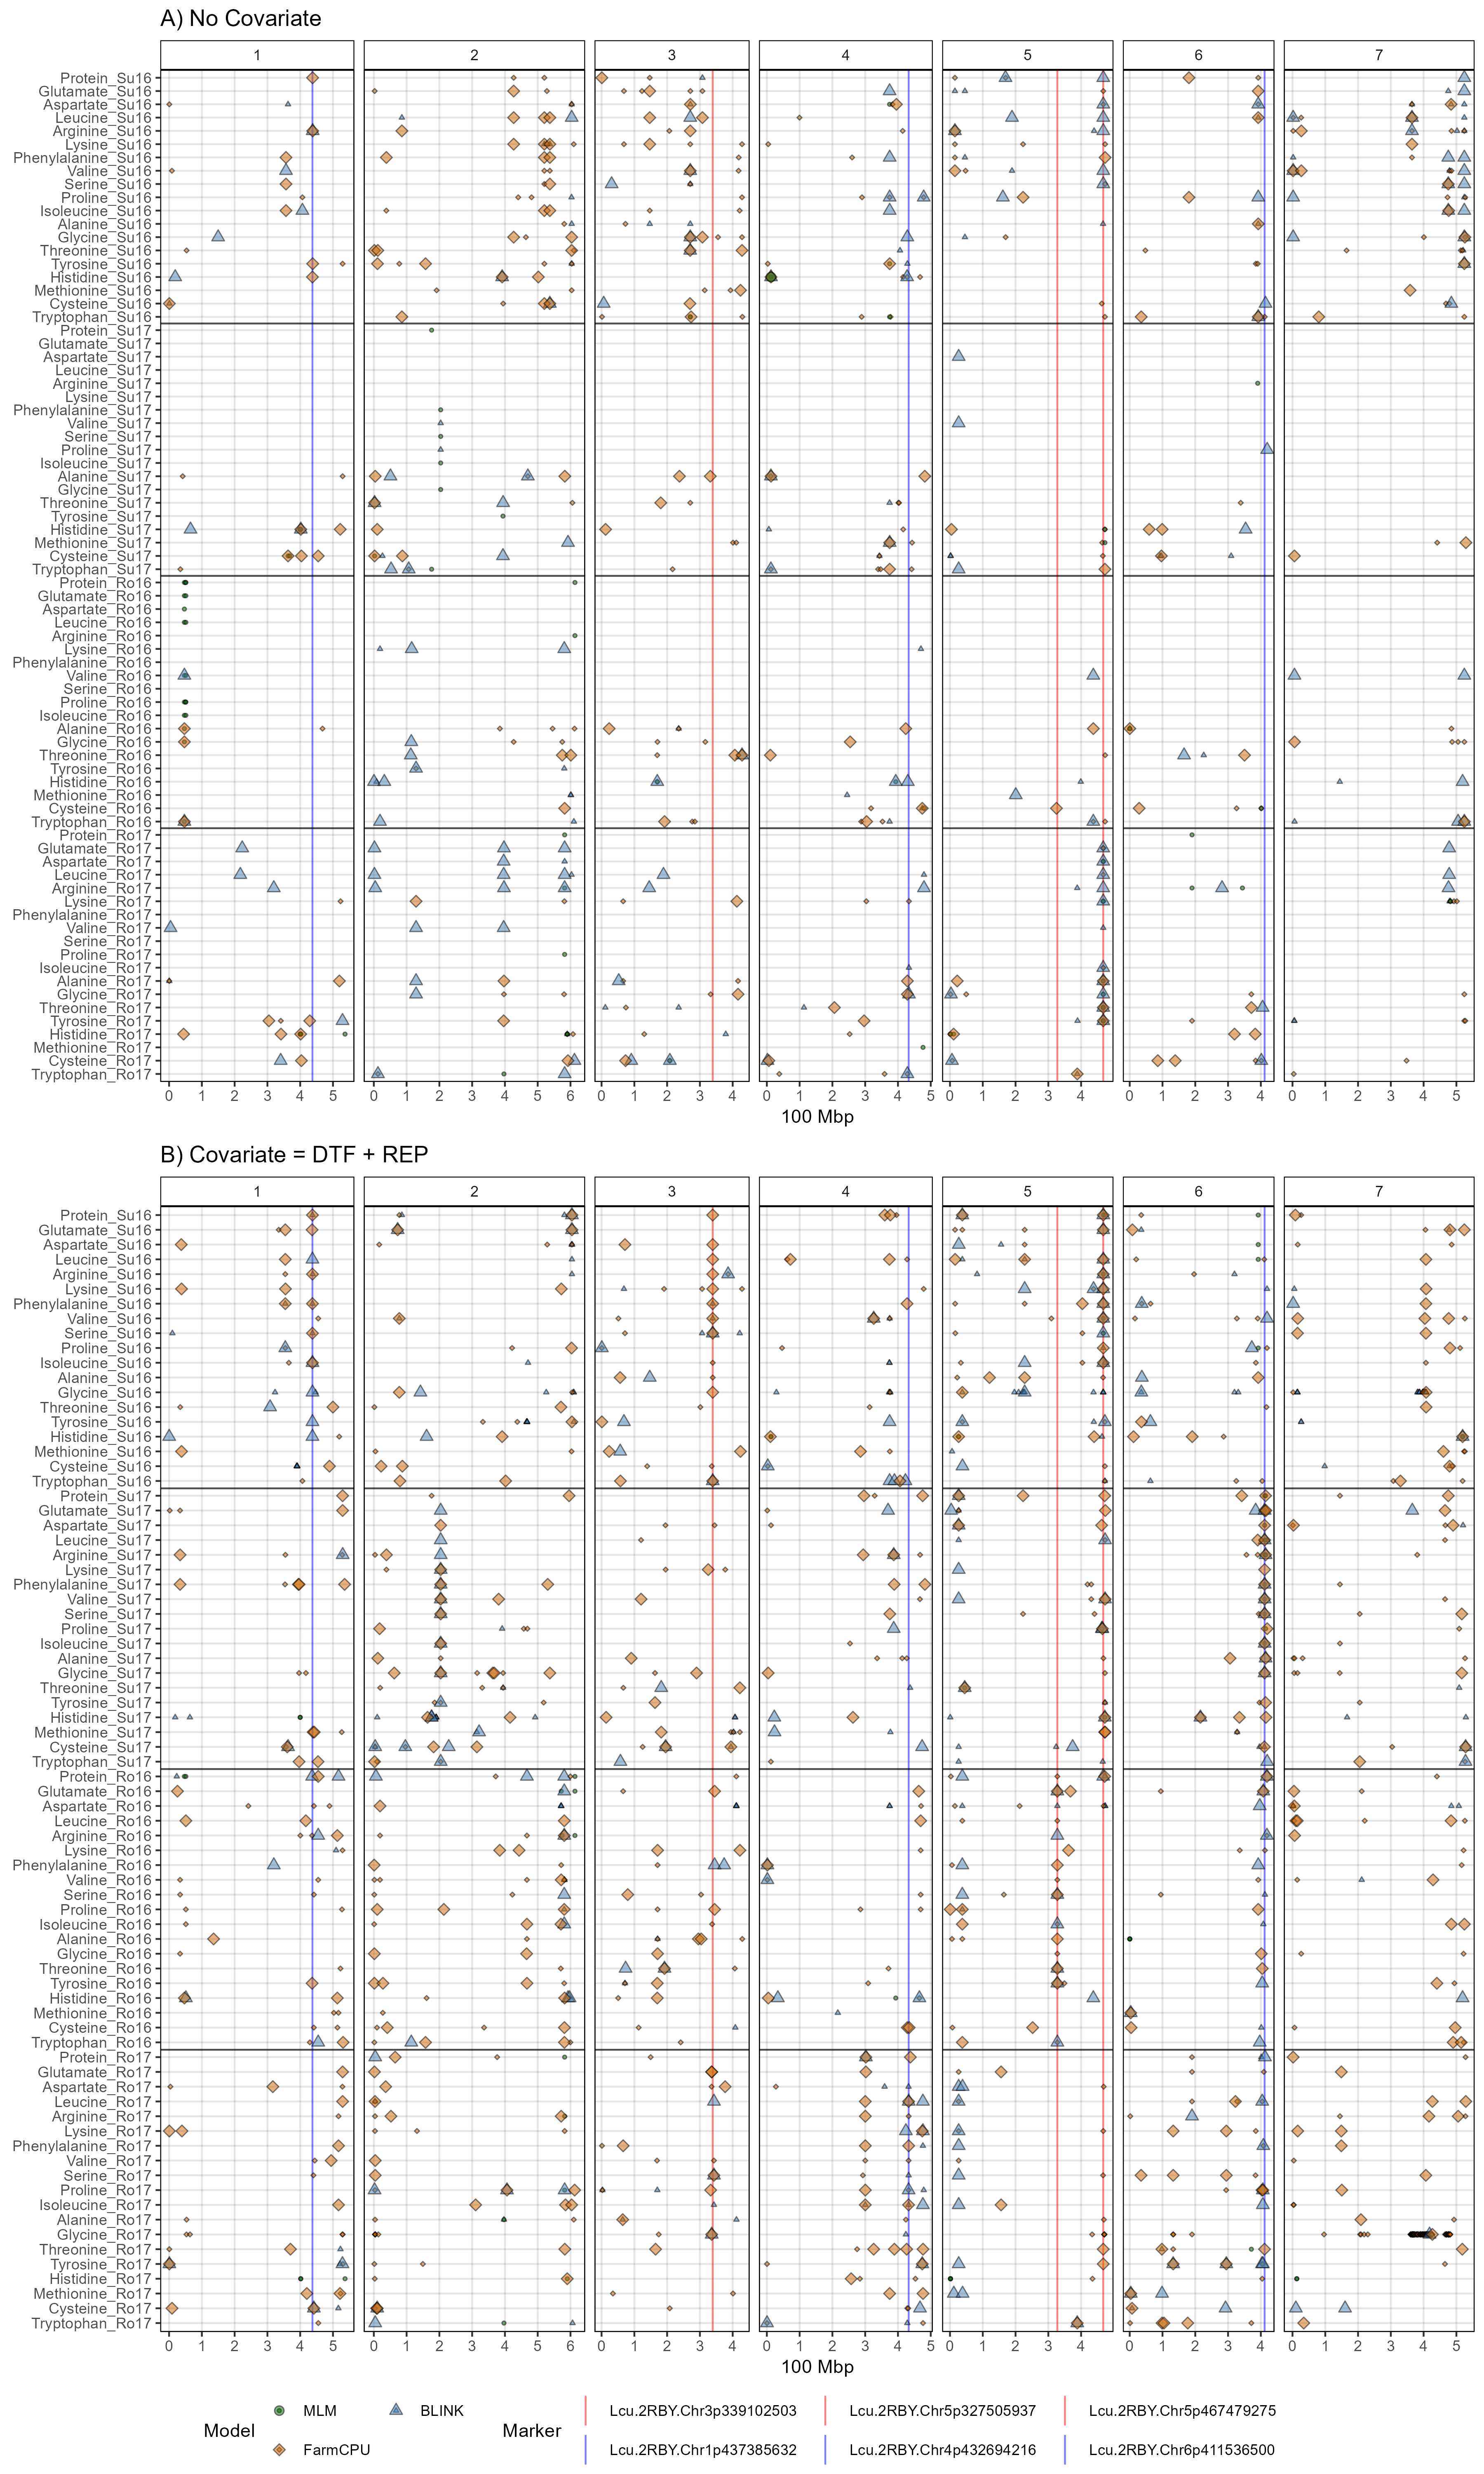
Figure 5

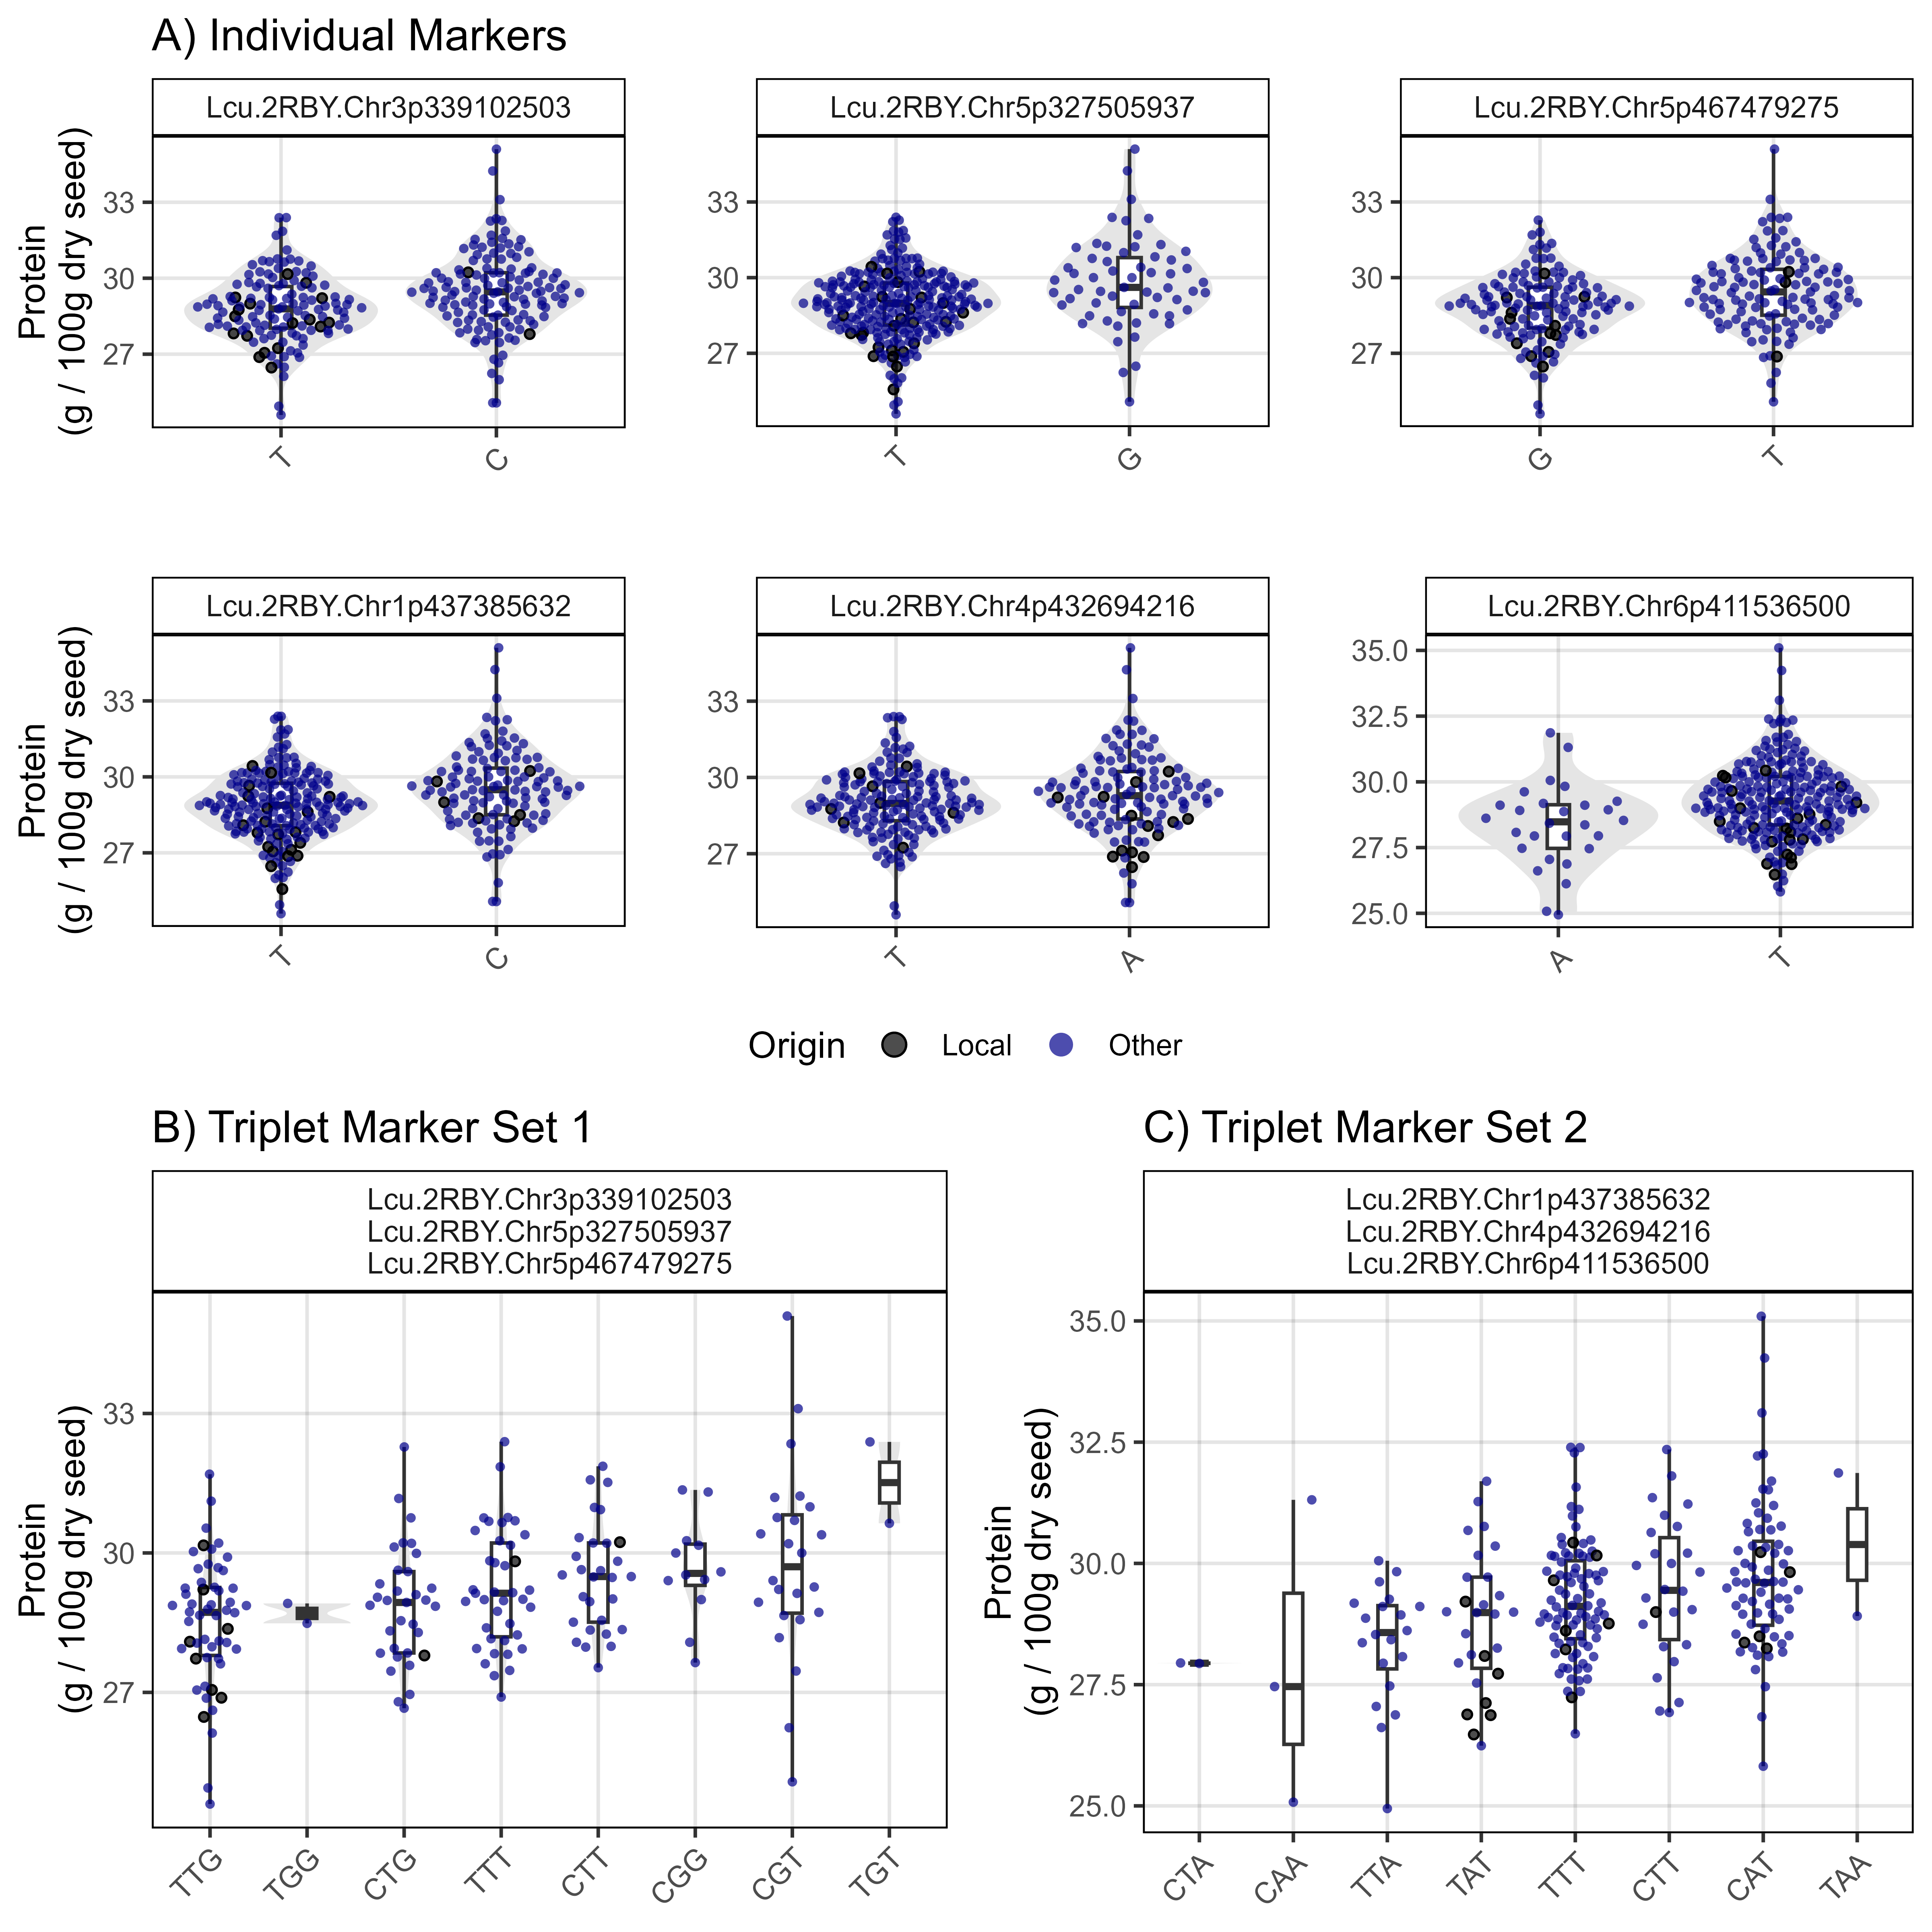
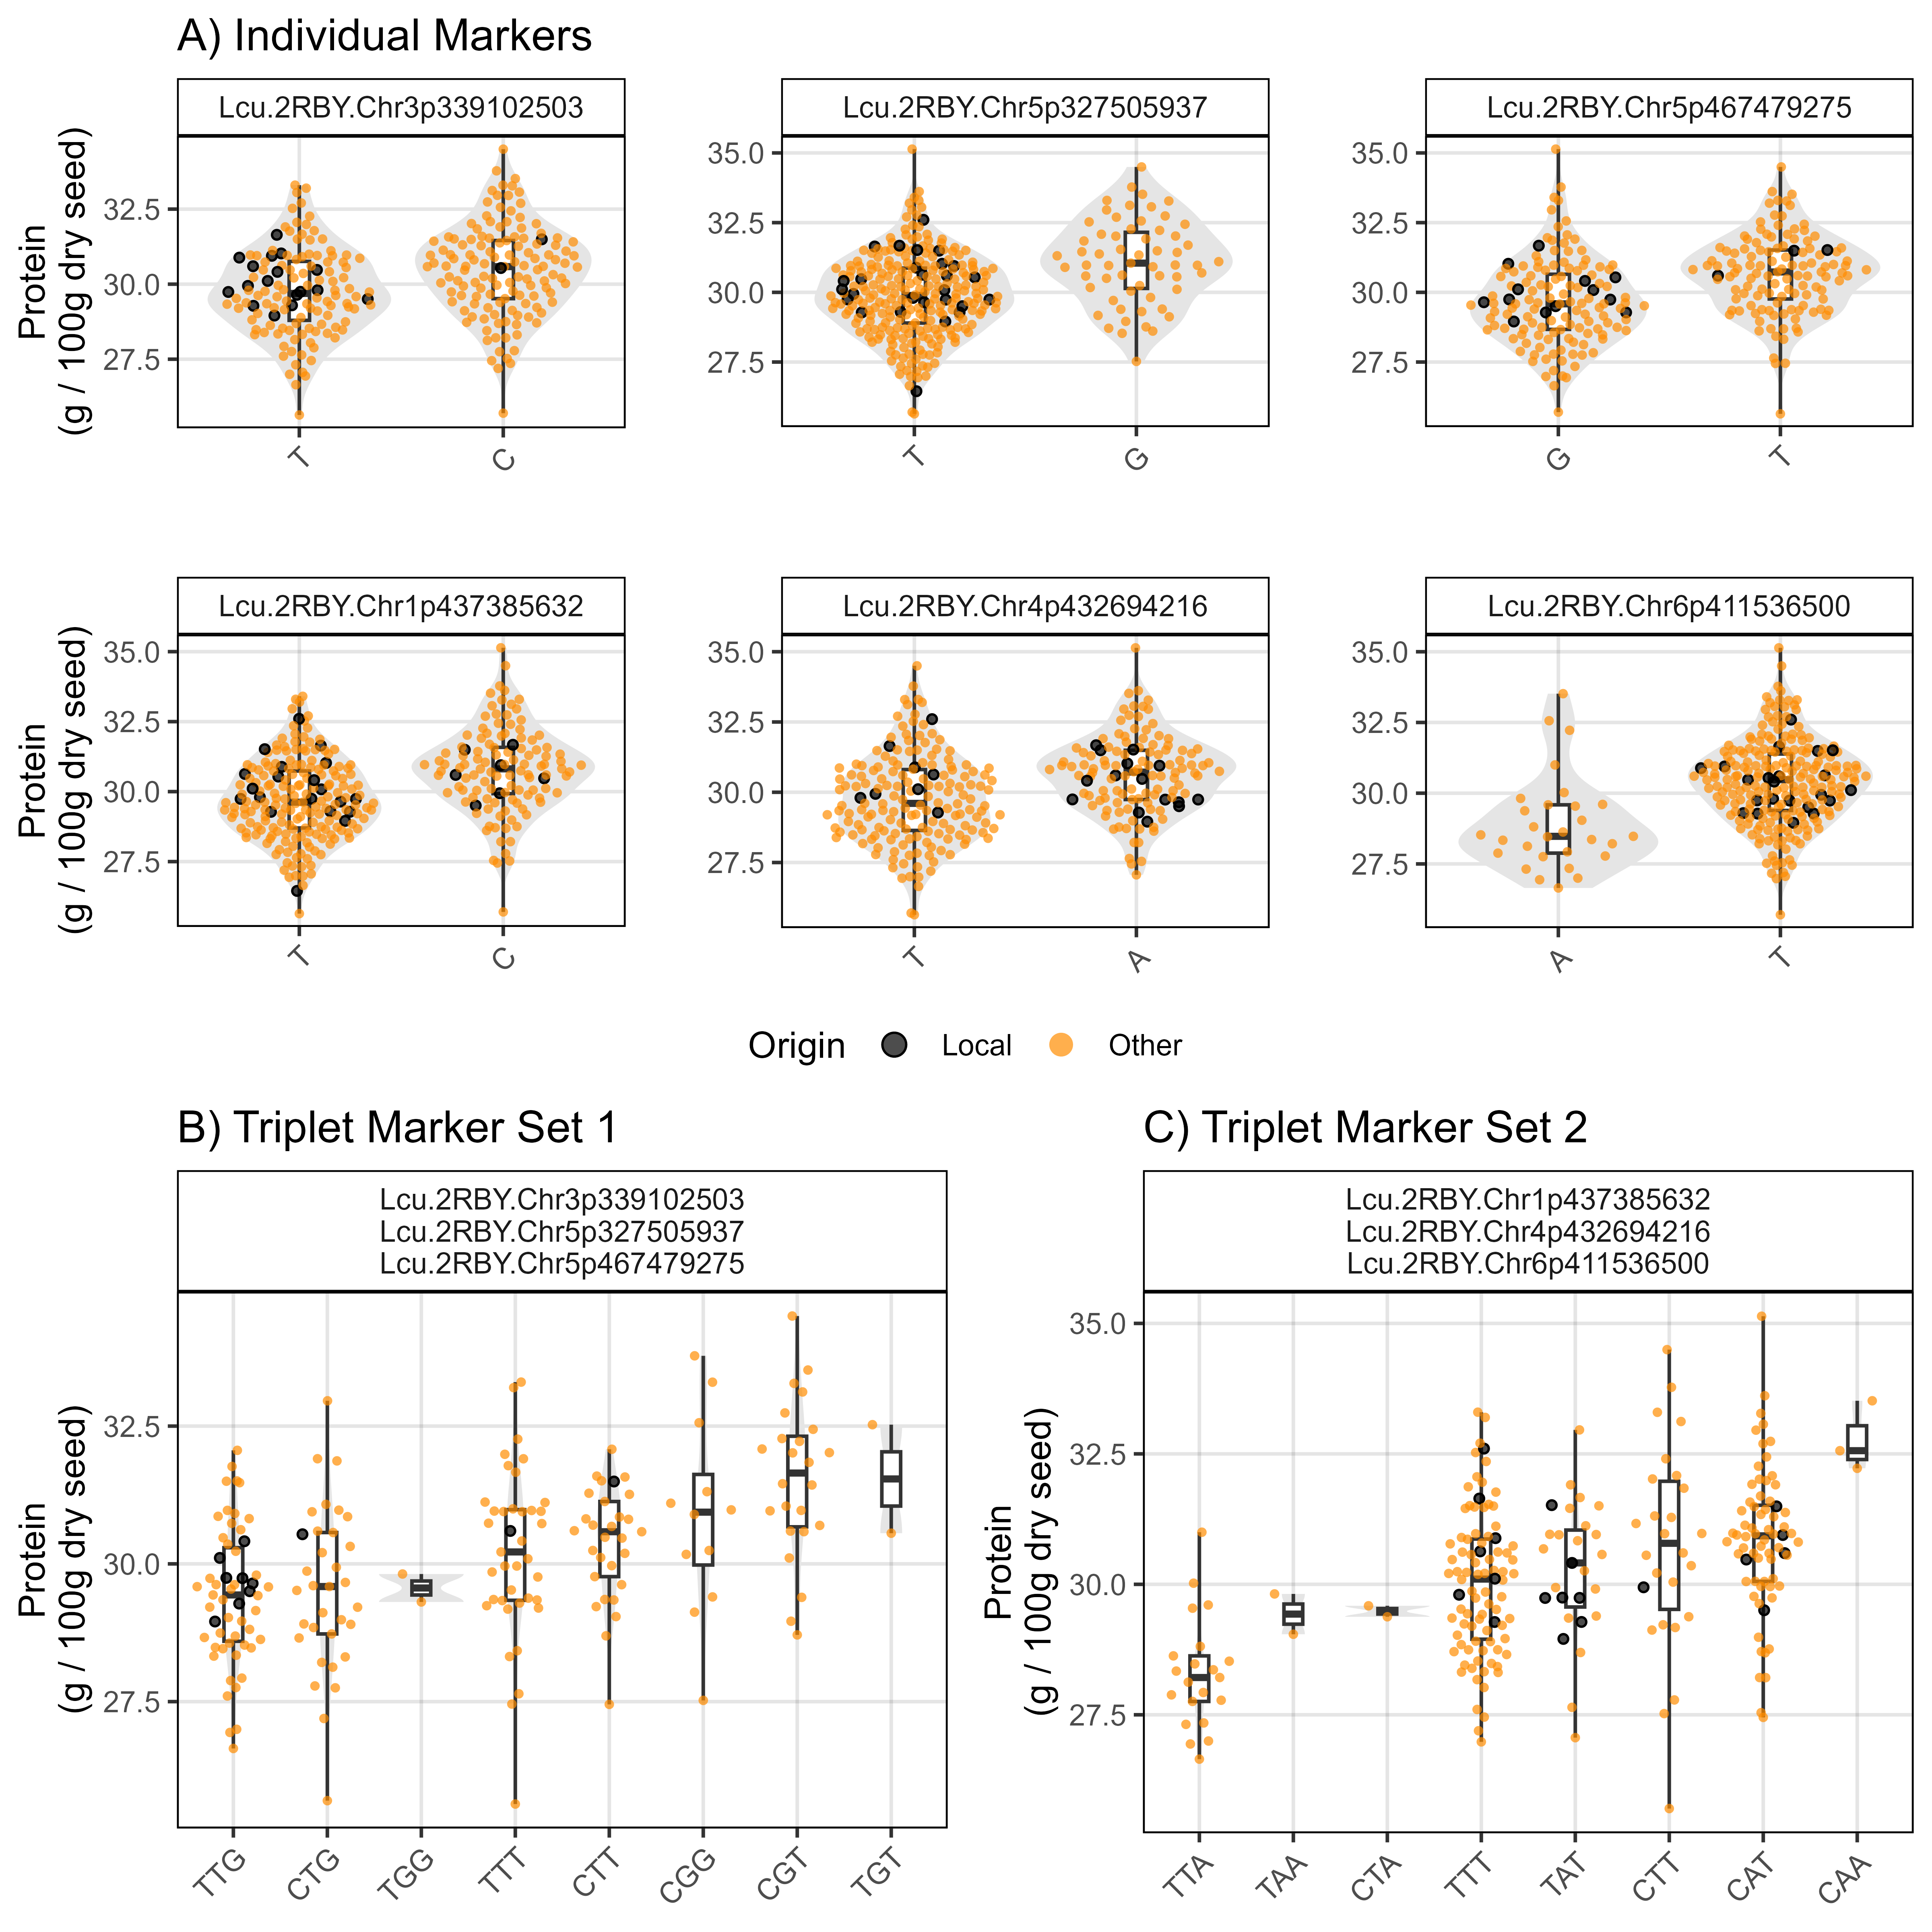
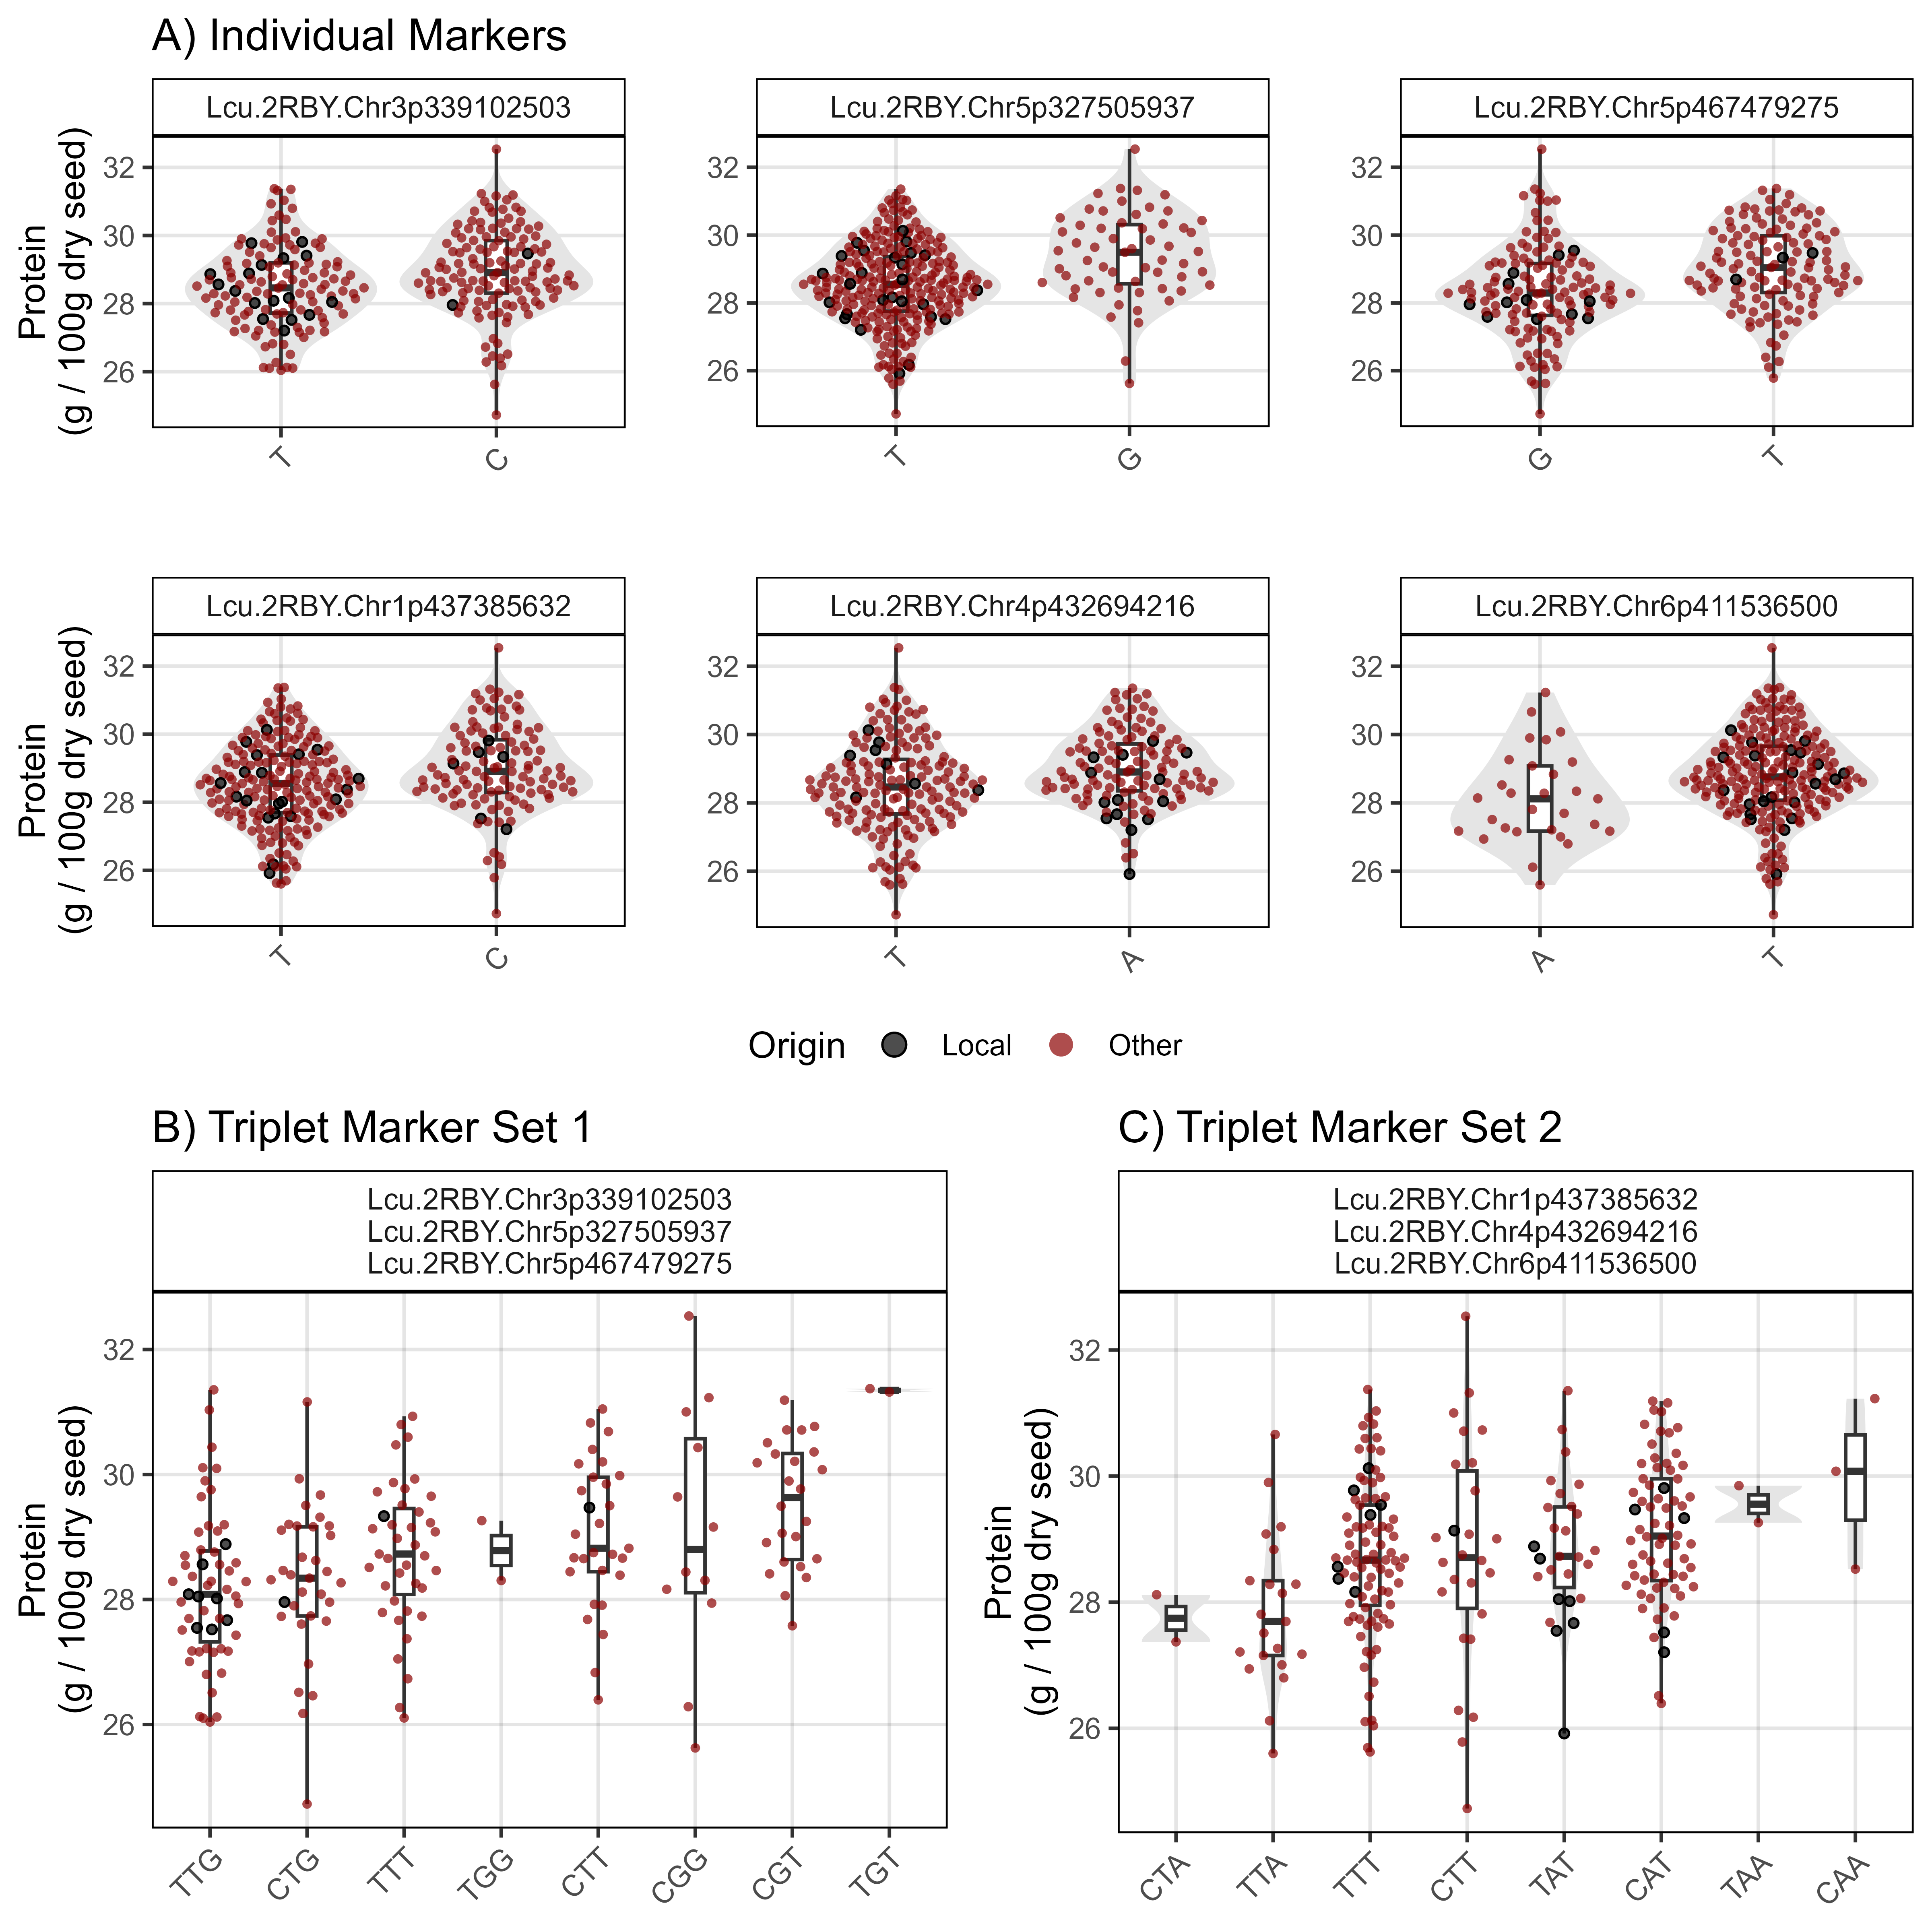
Supplemental Figures
Supplemental Figure 1
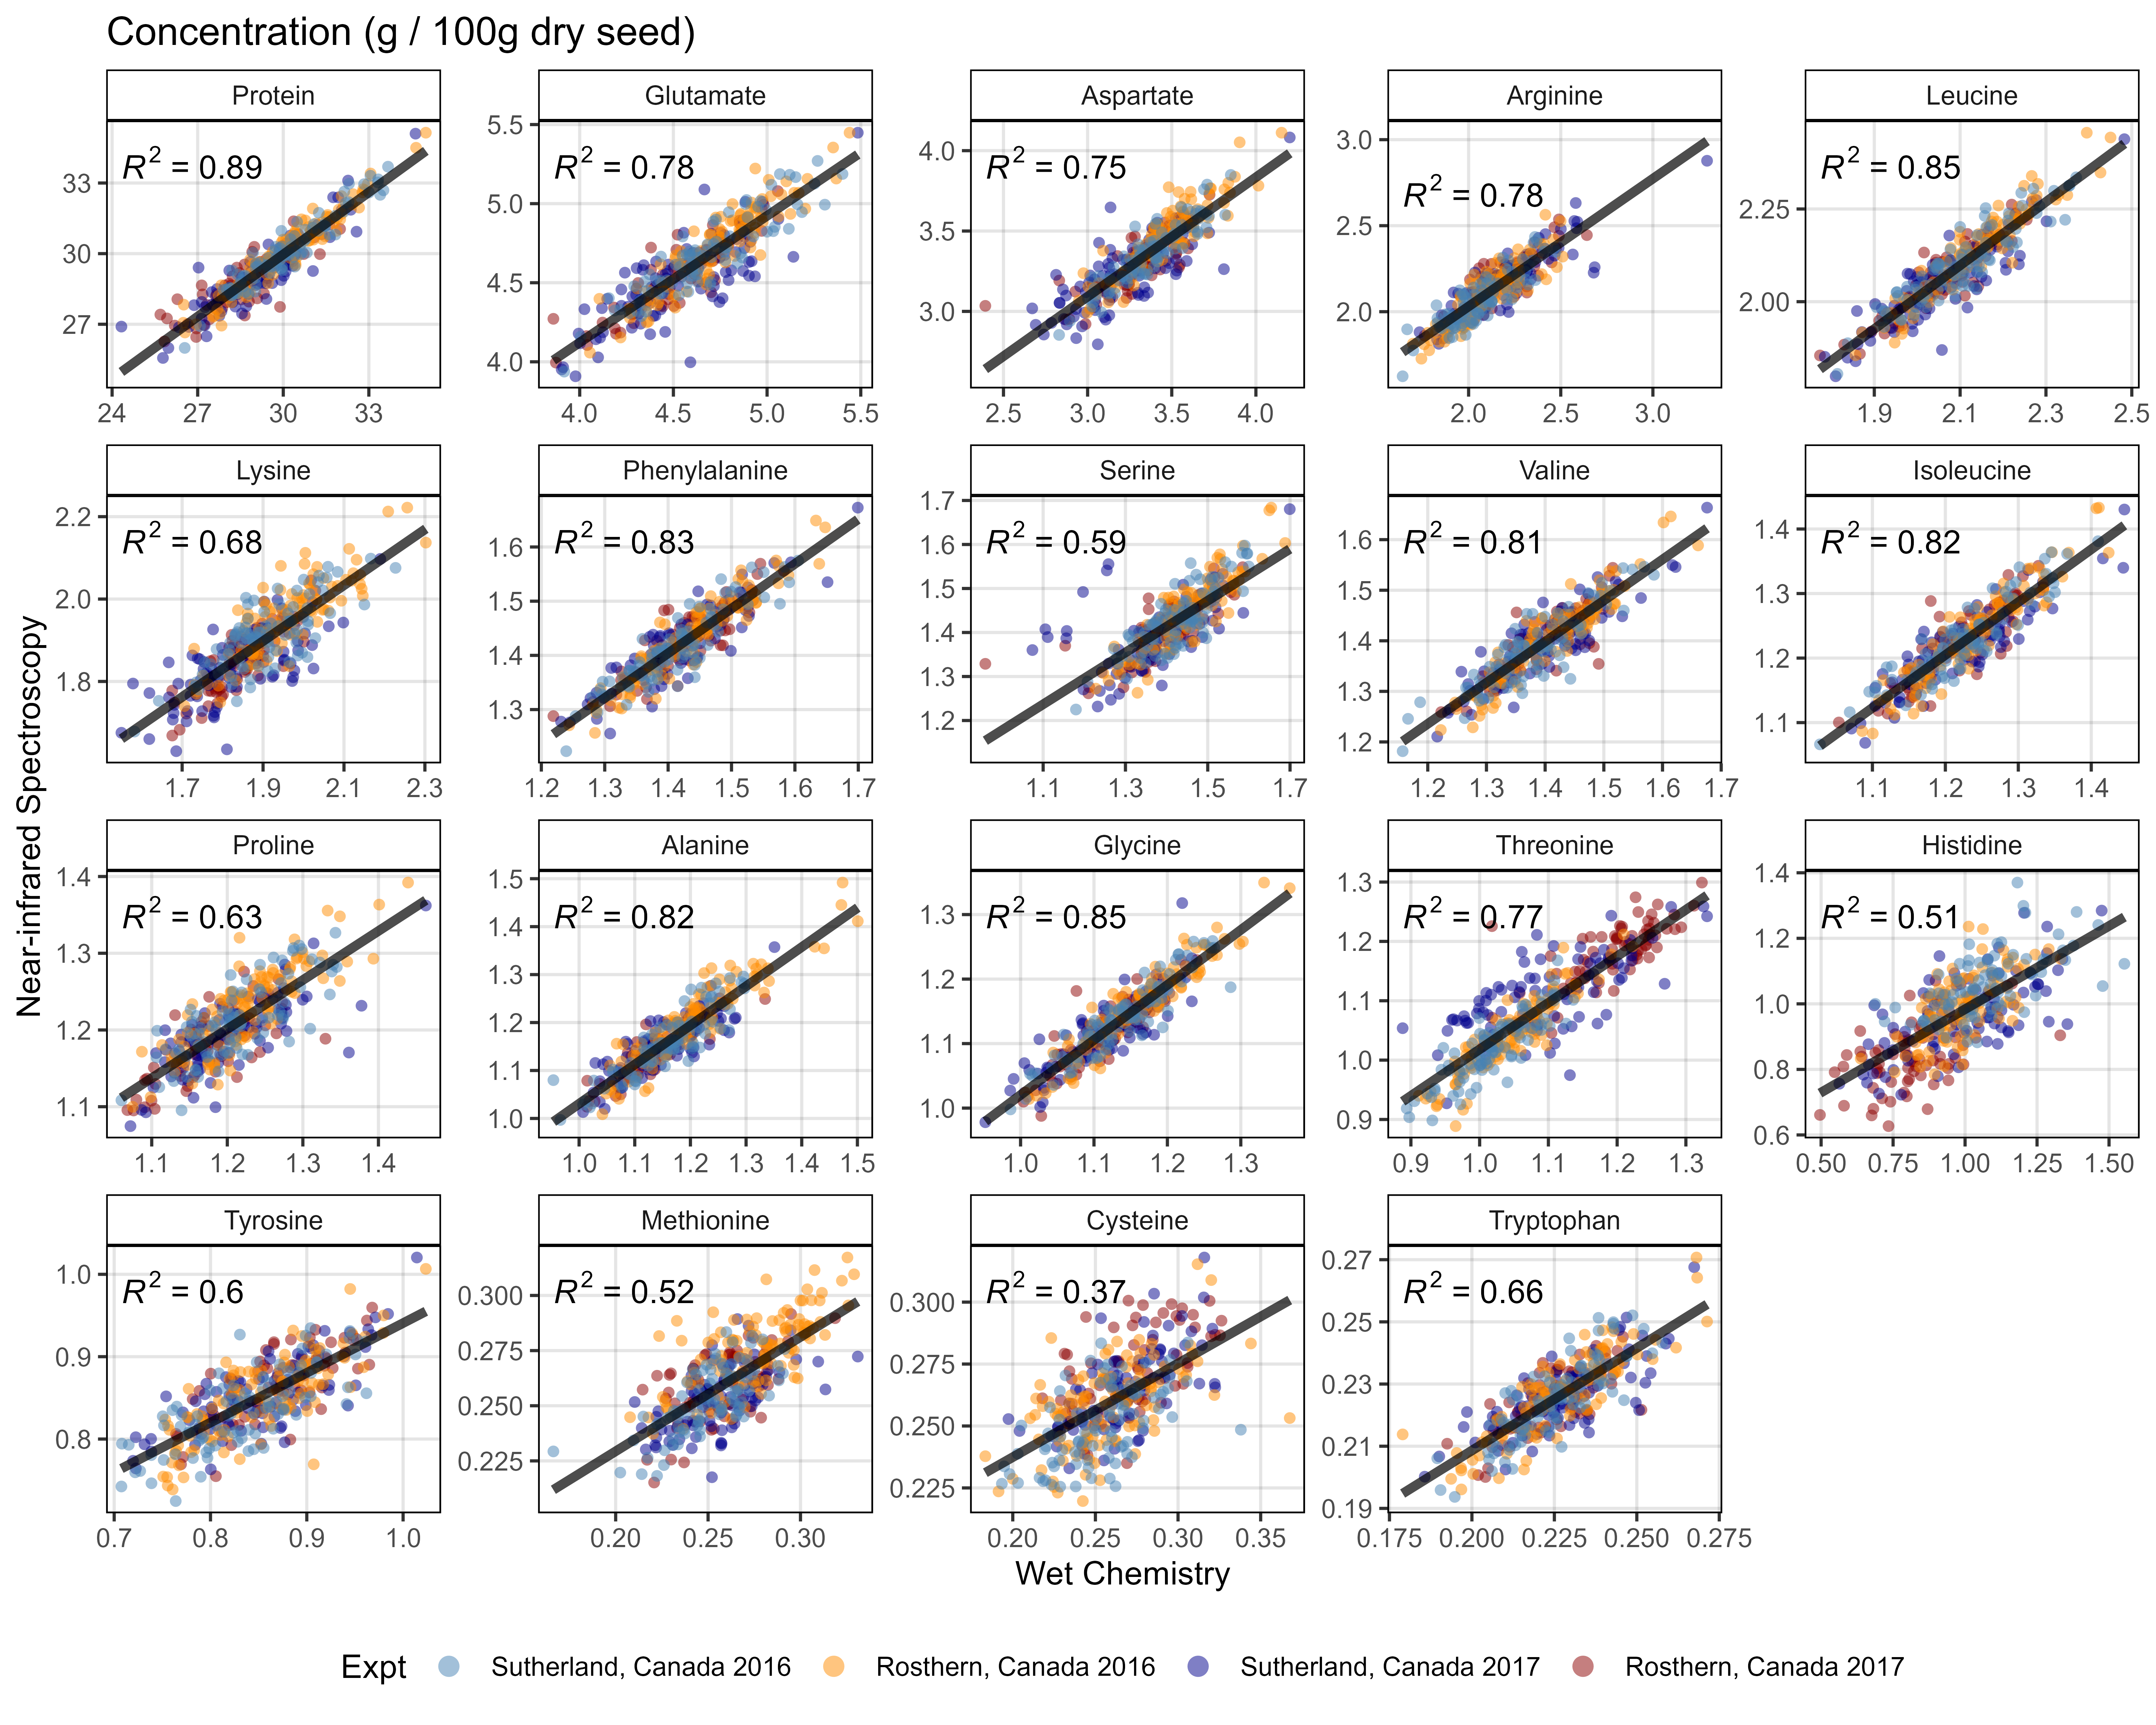
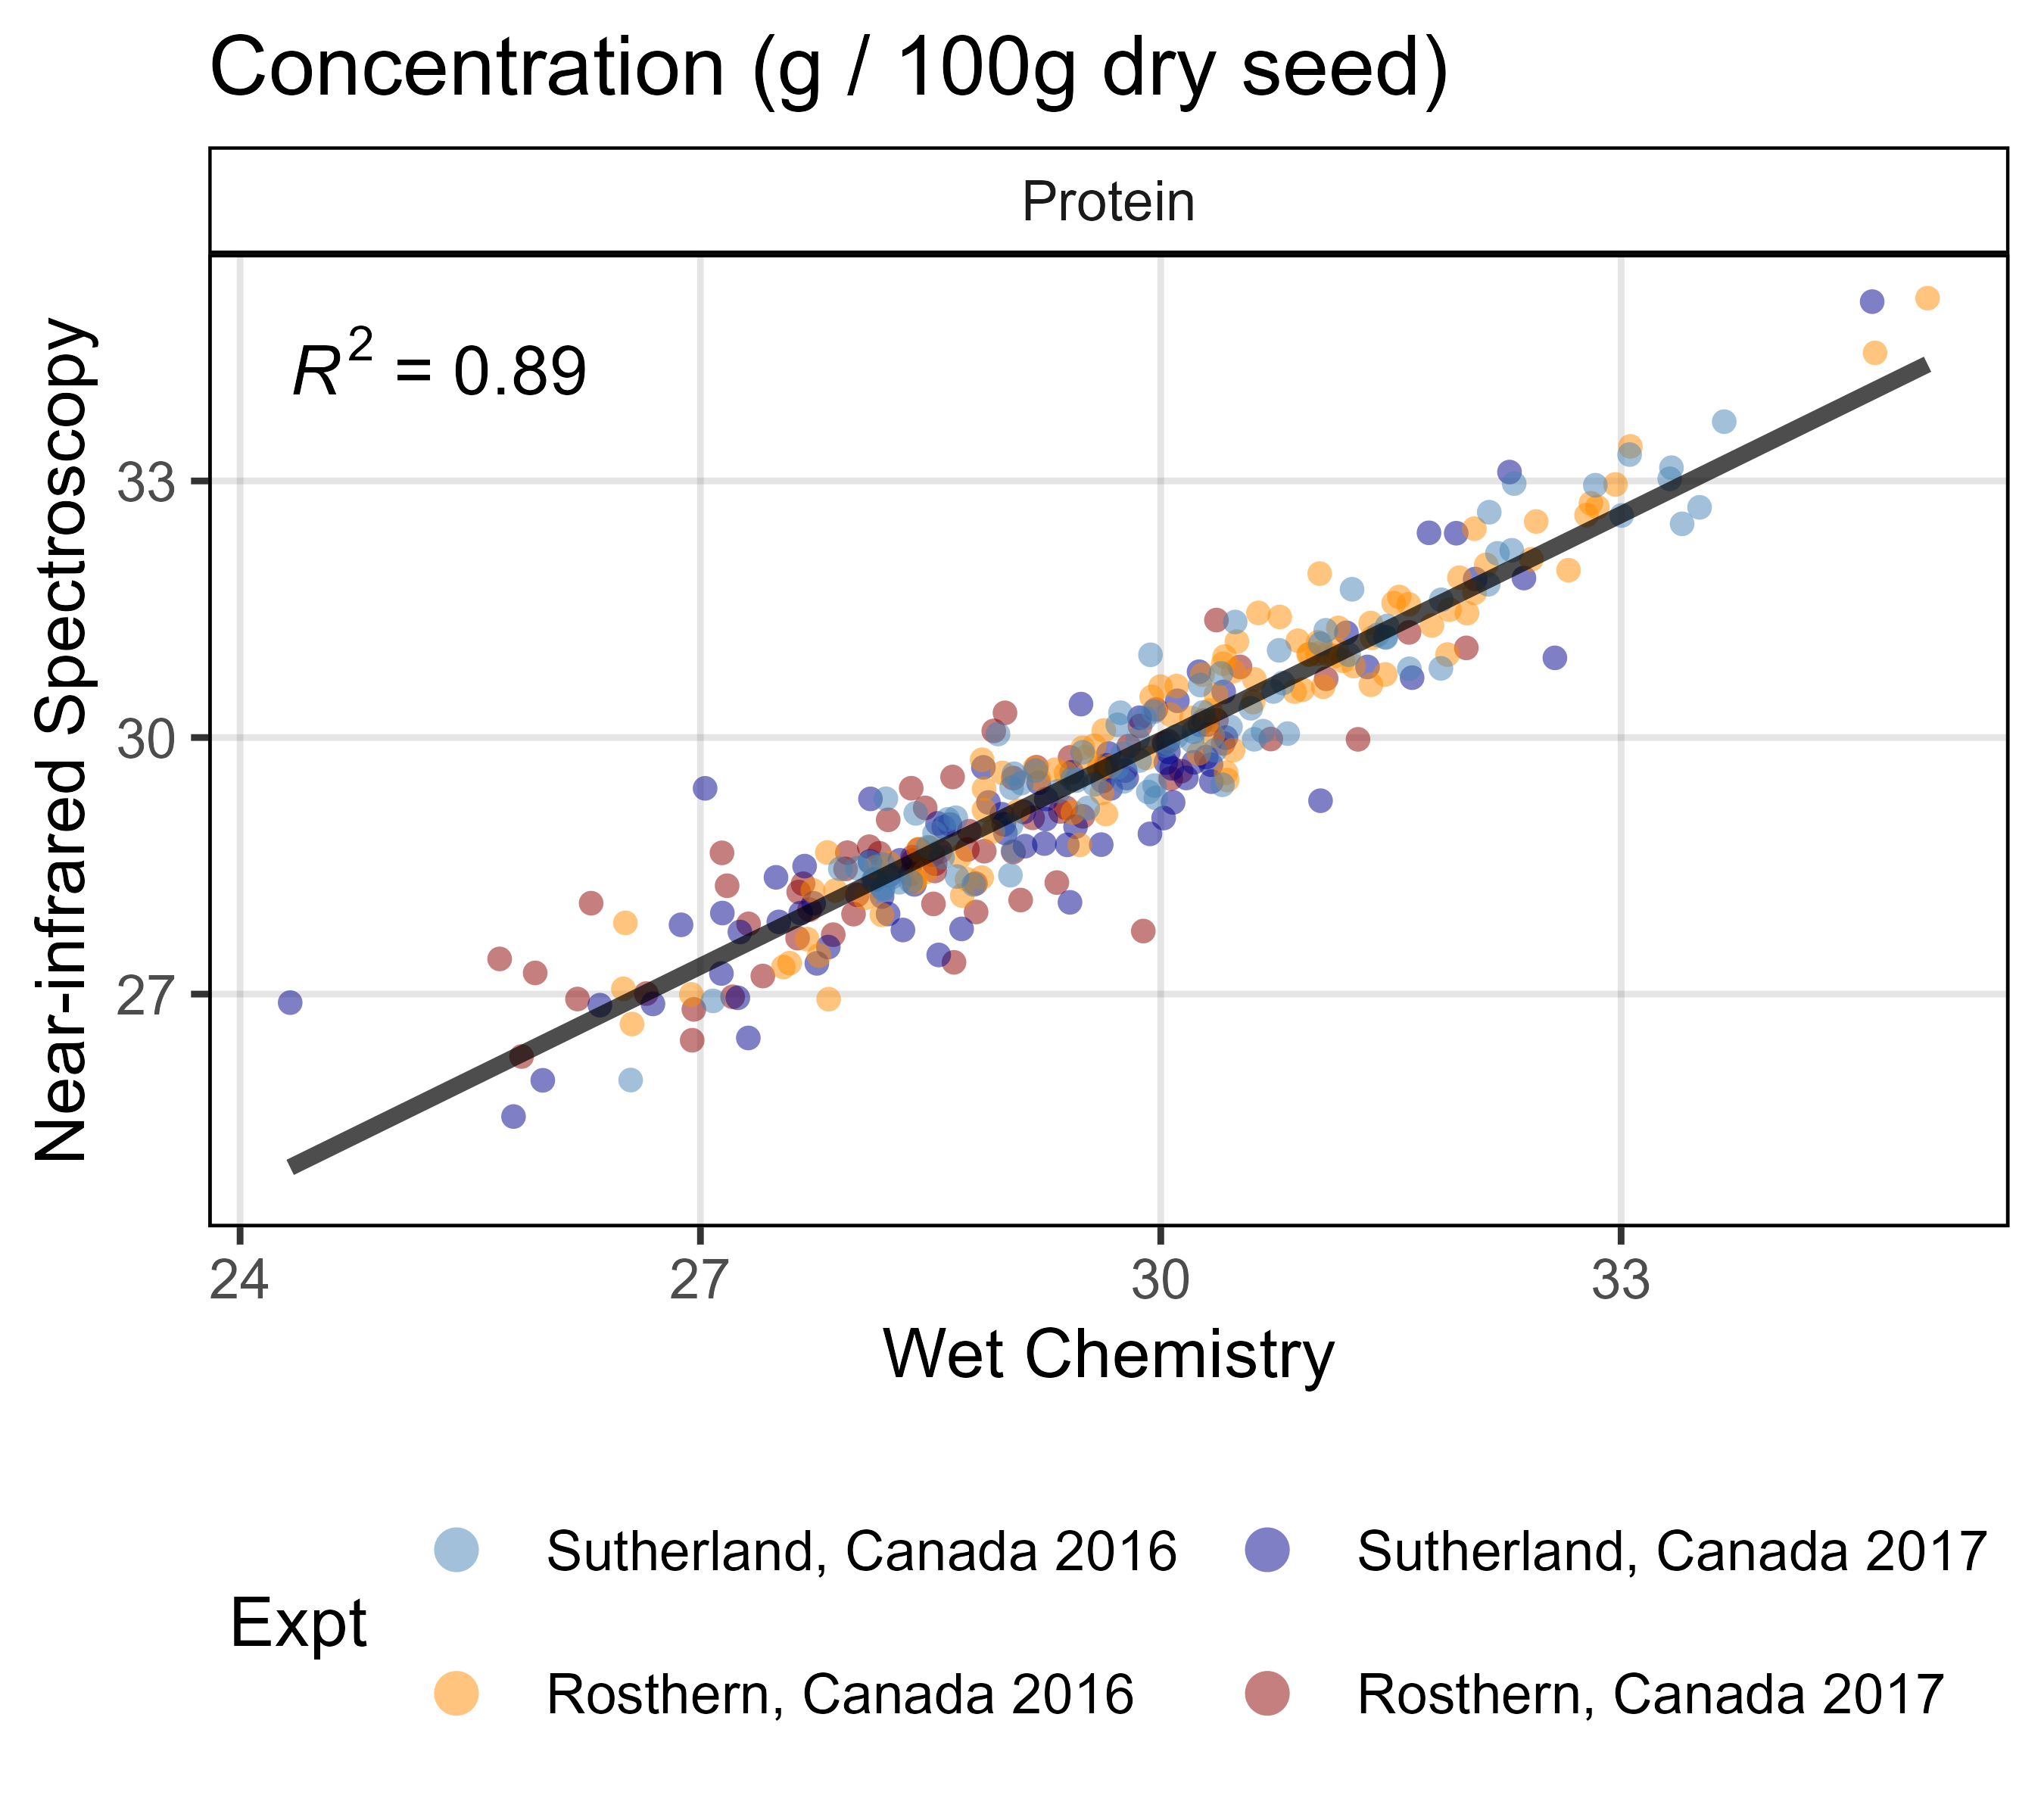
Supplemental Figure 2

Supplemental Figure 3
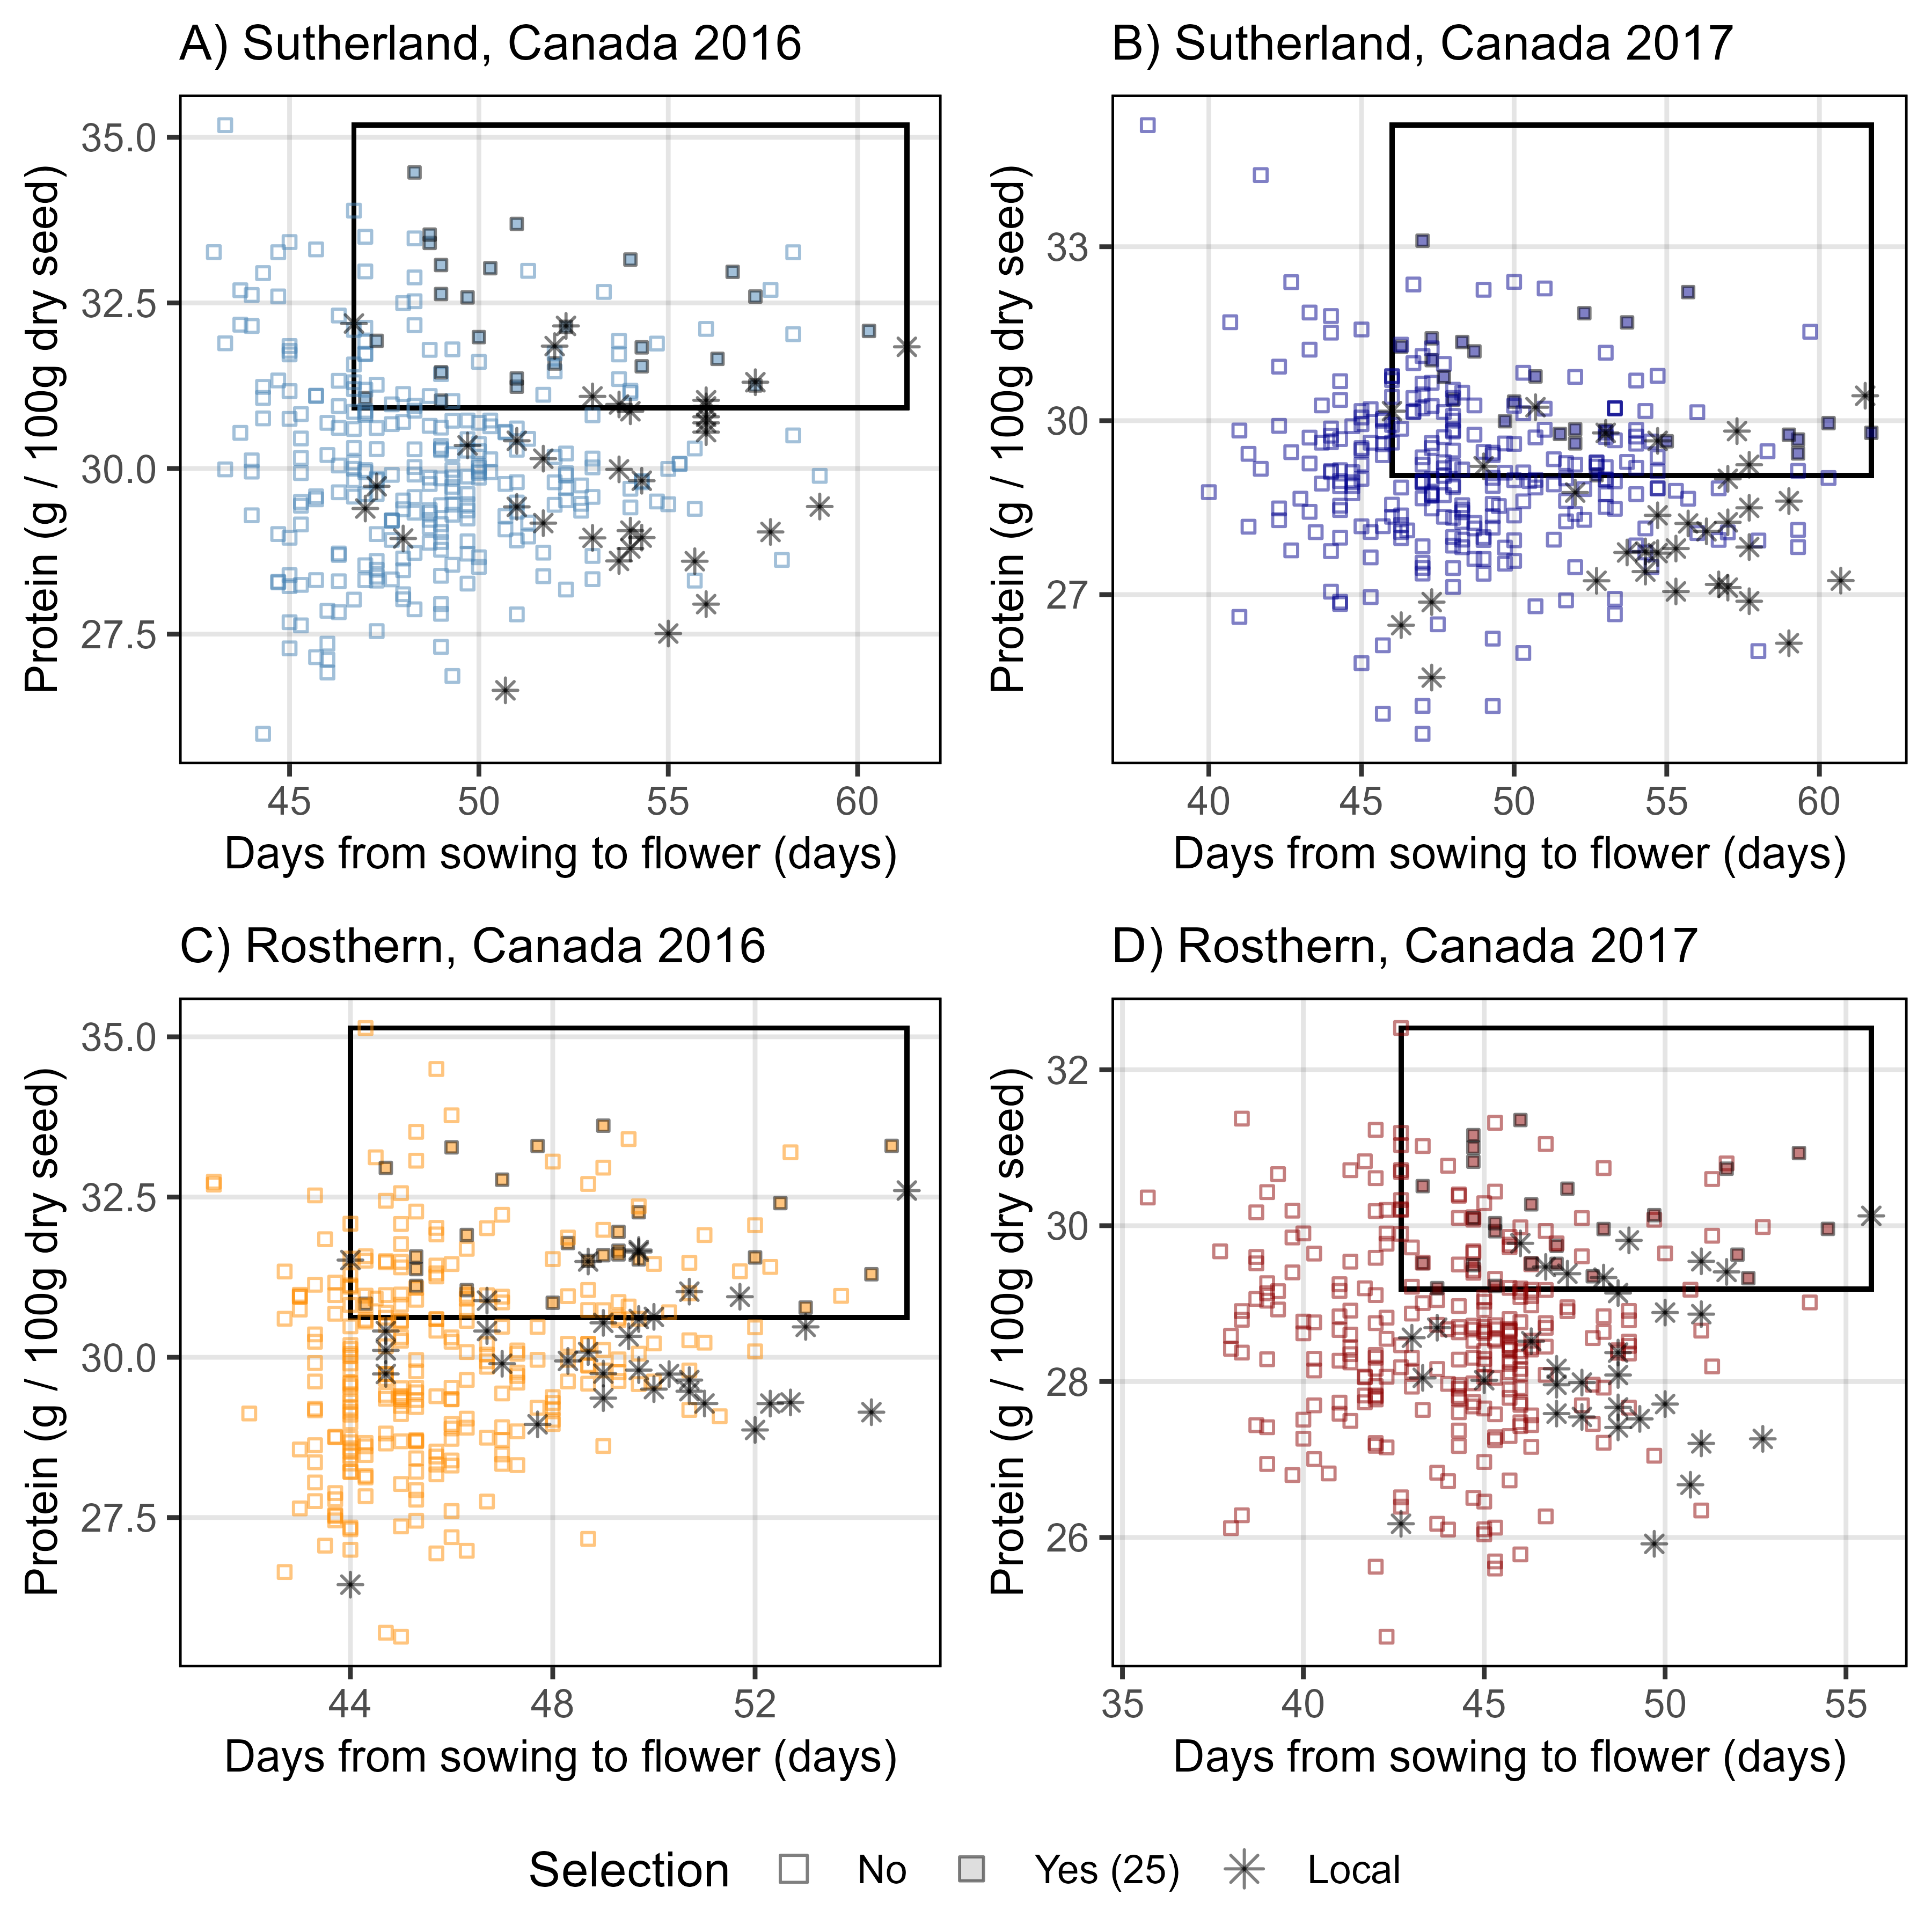
Supplemental Figure 4
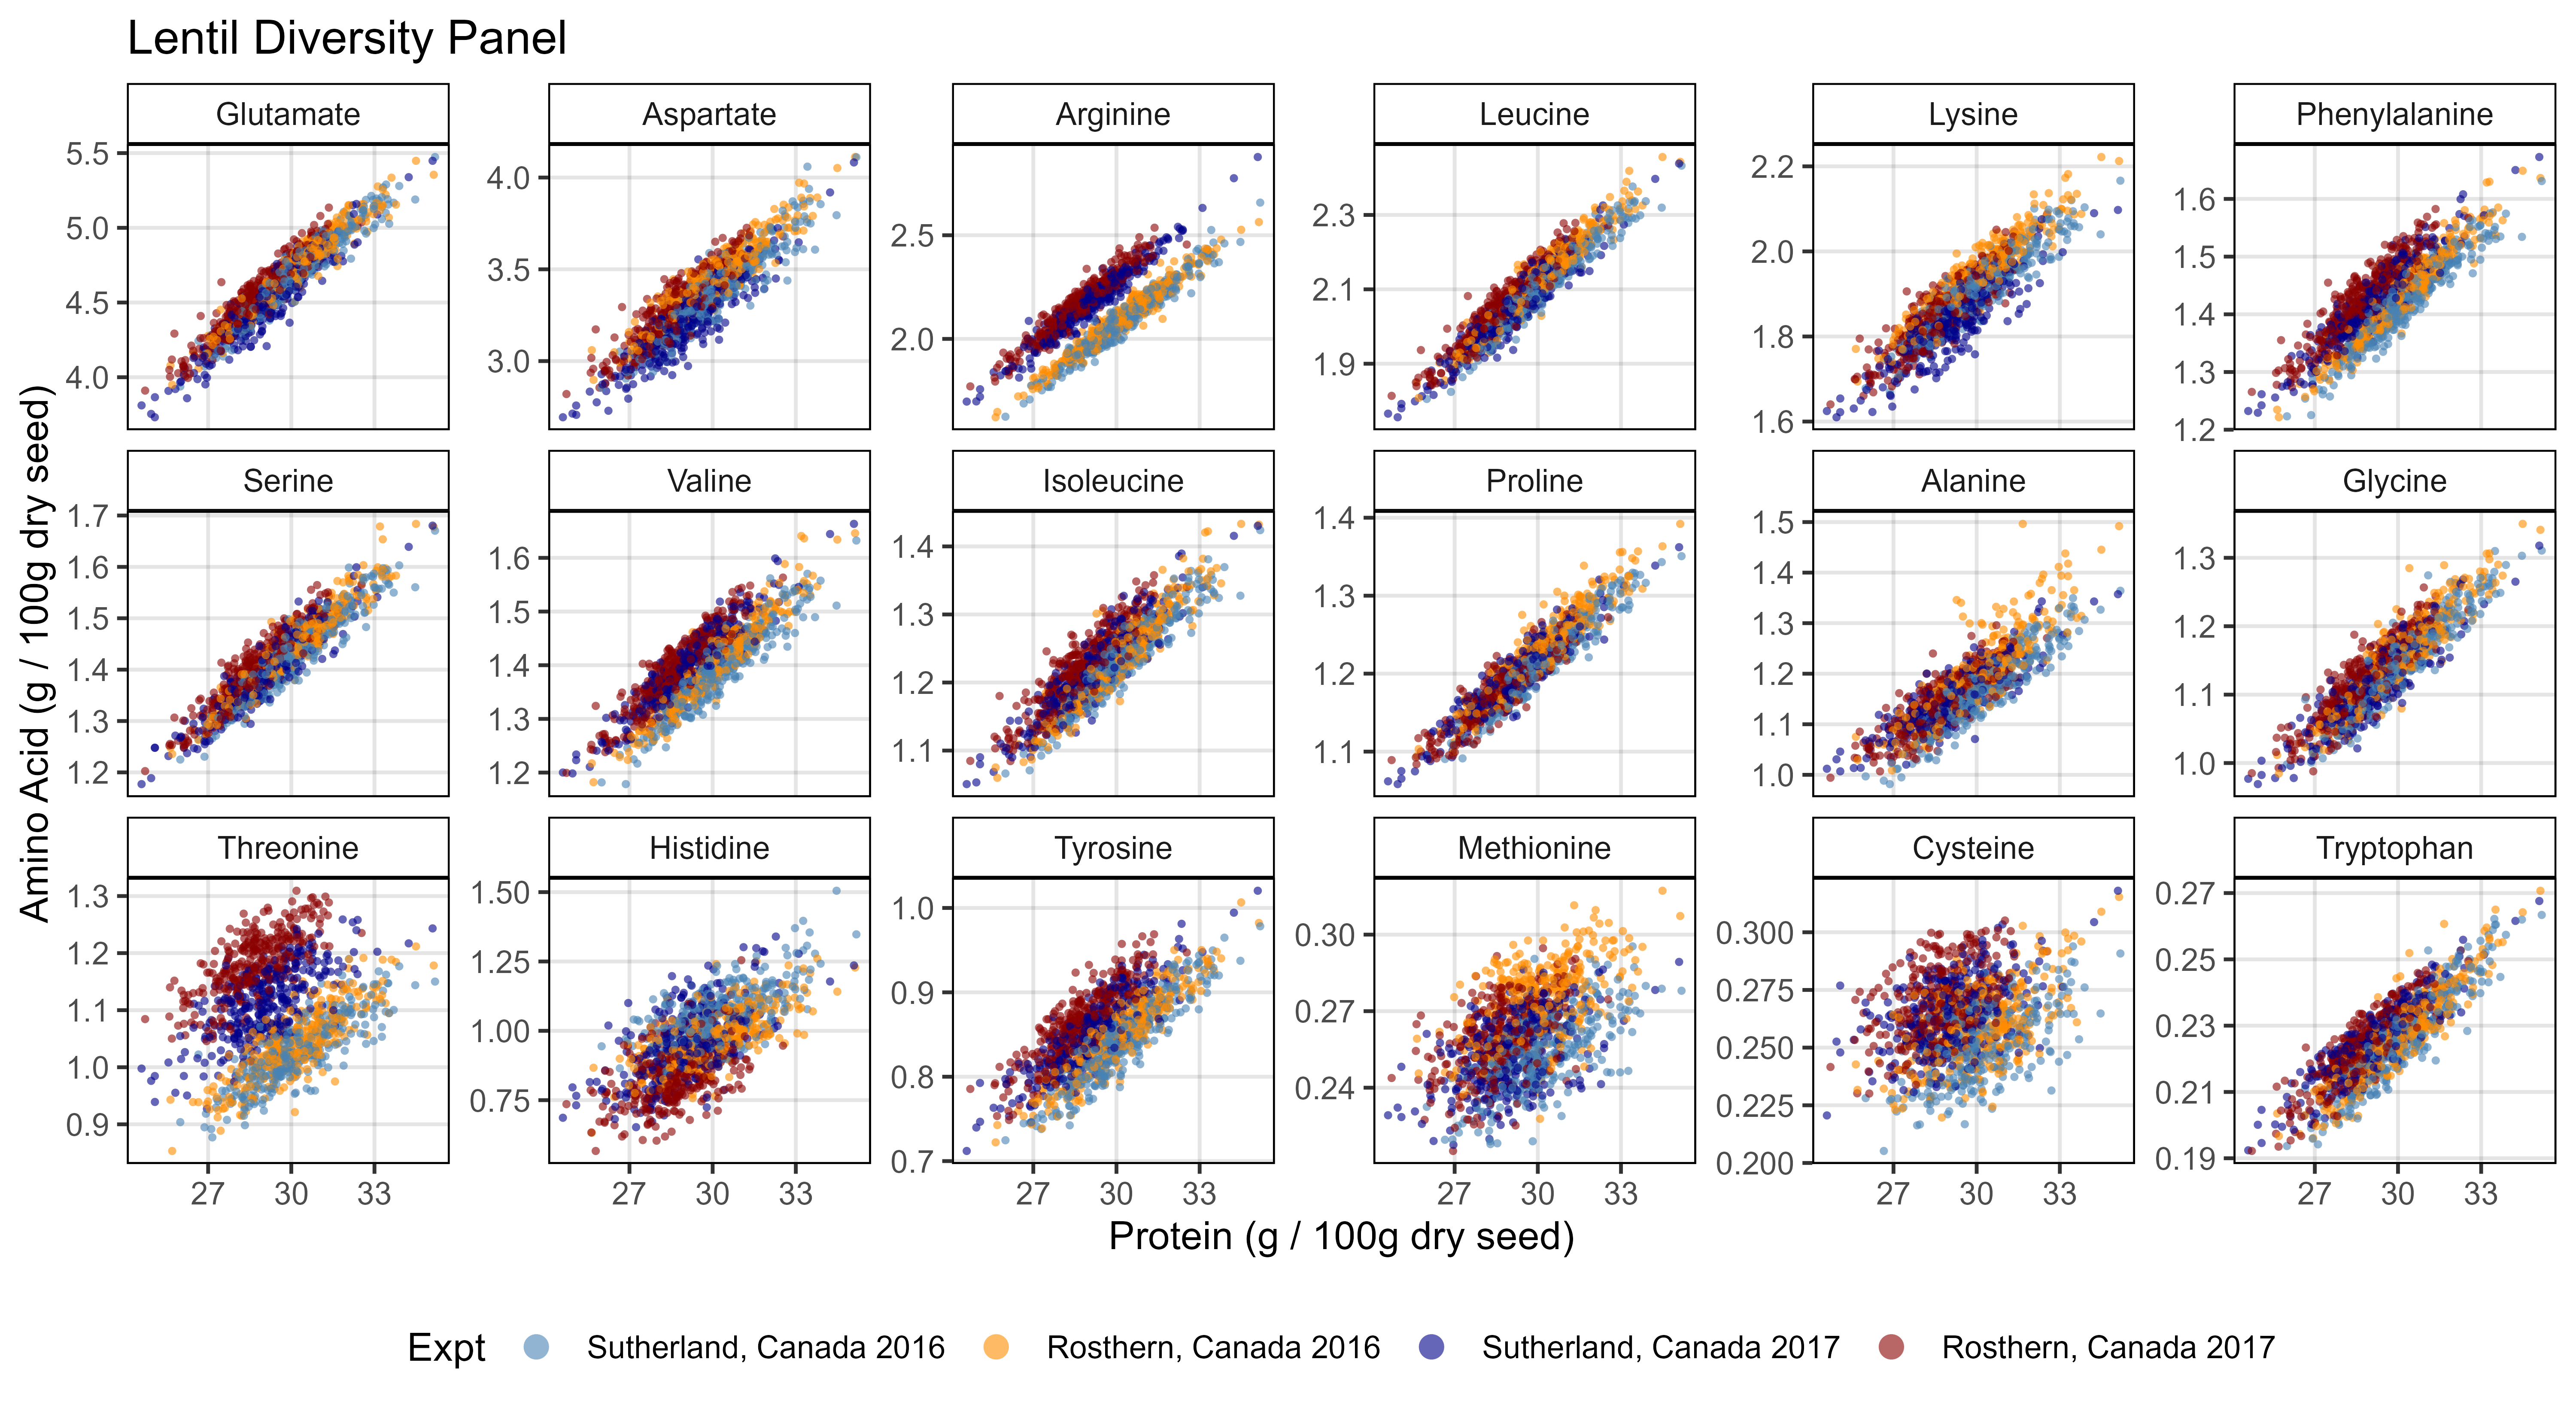
Supplemental Figure 5

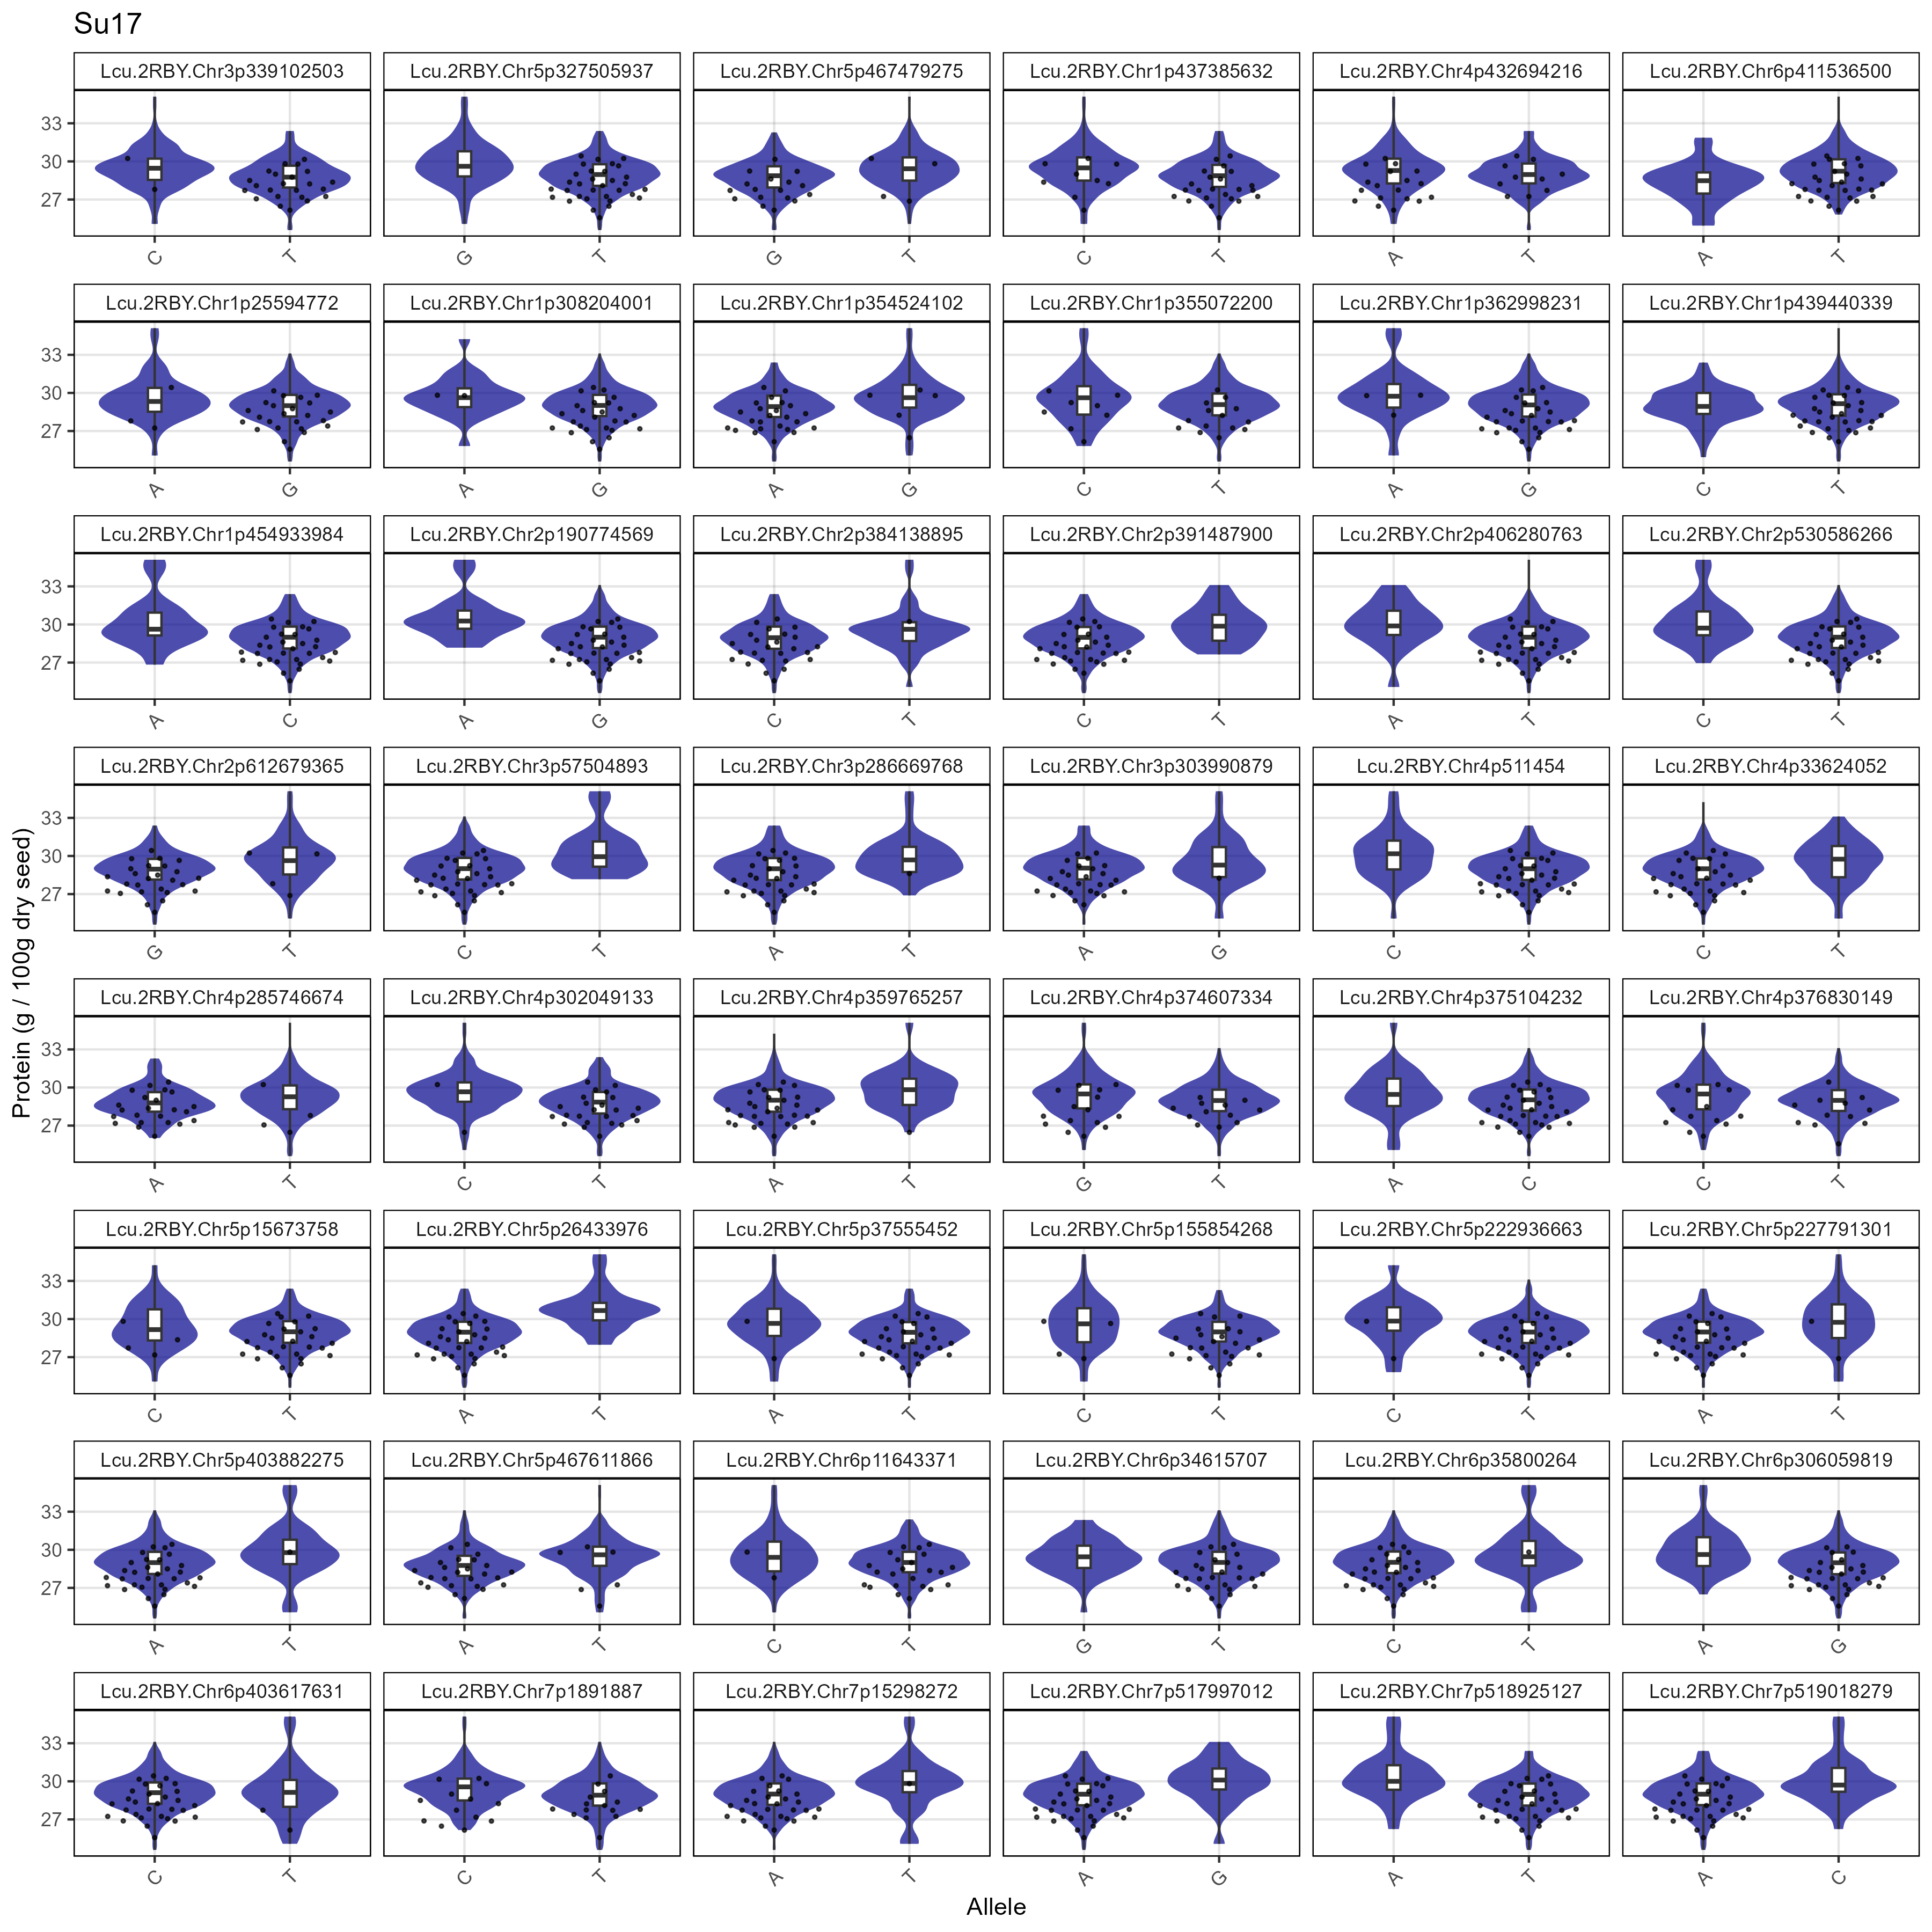
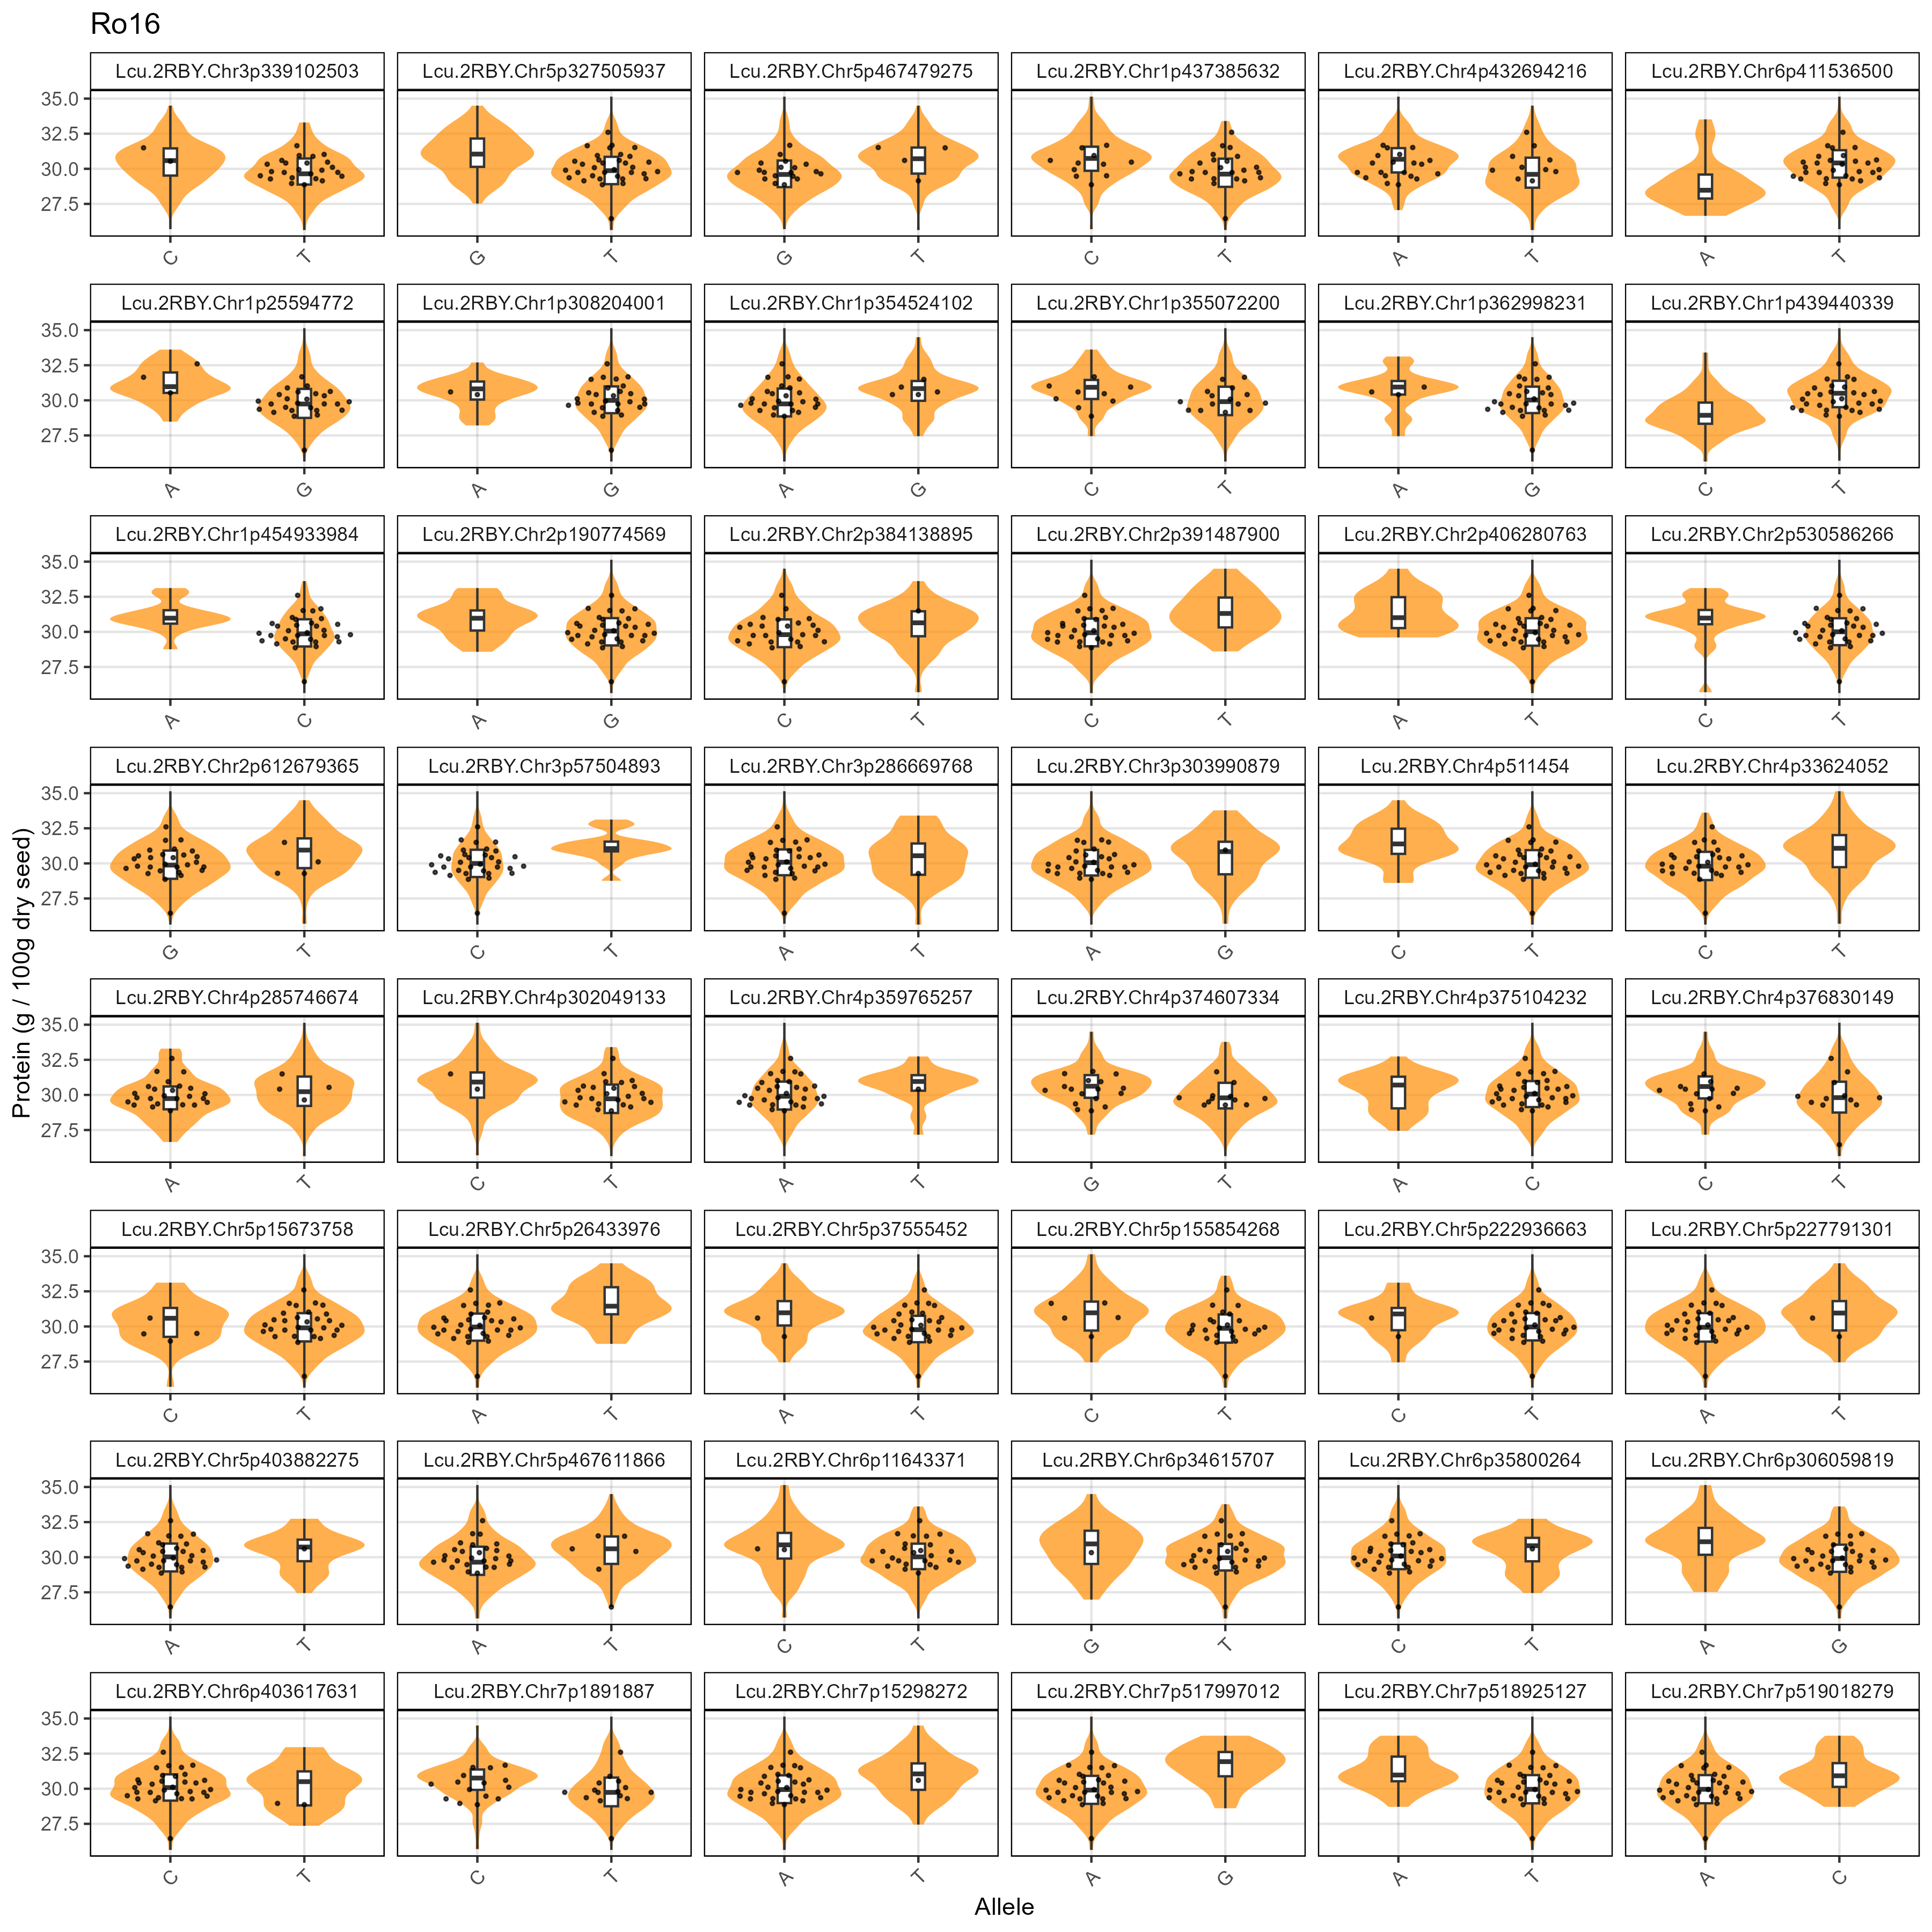
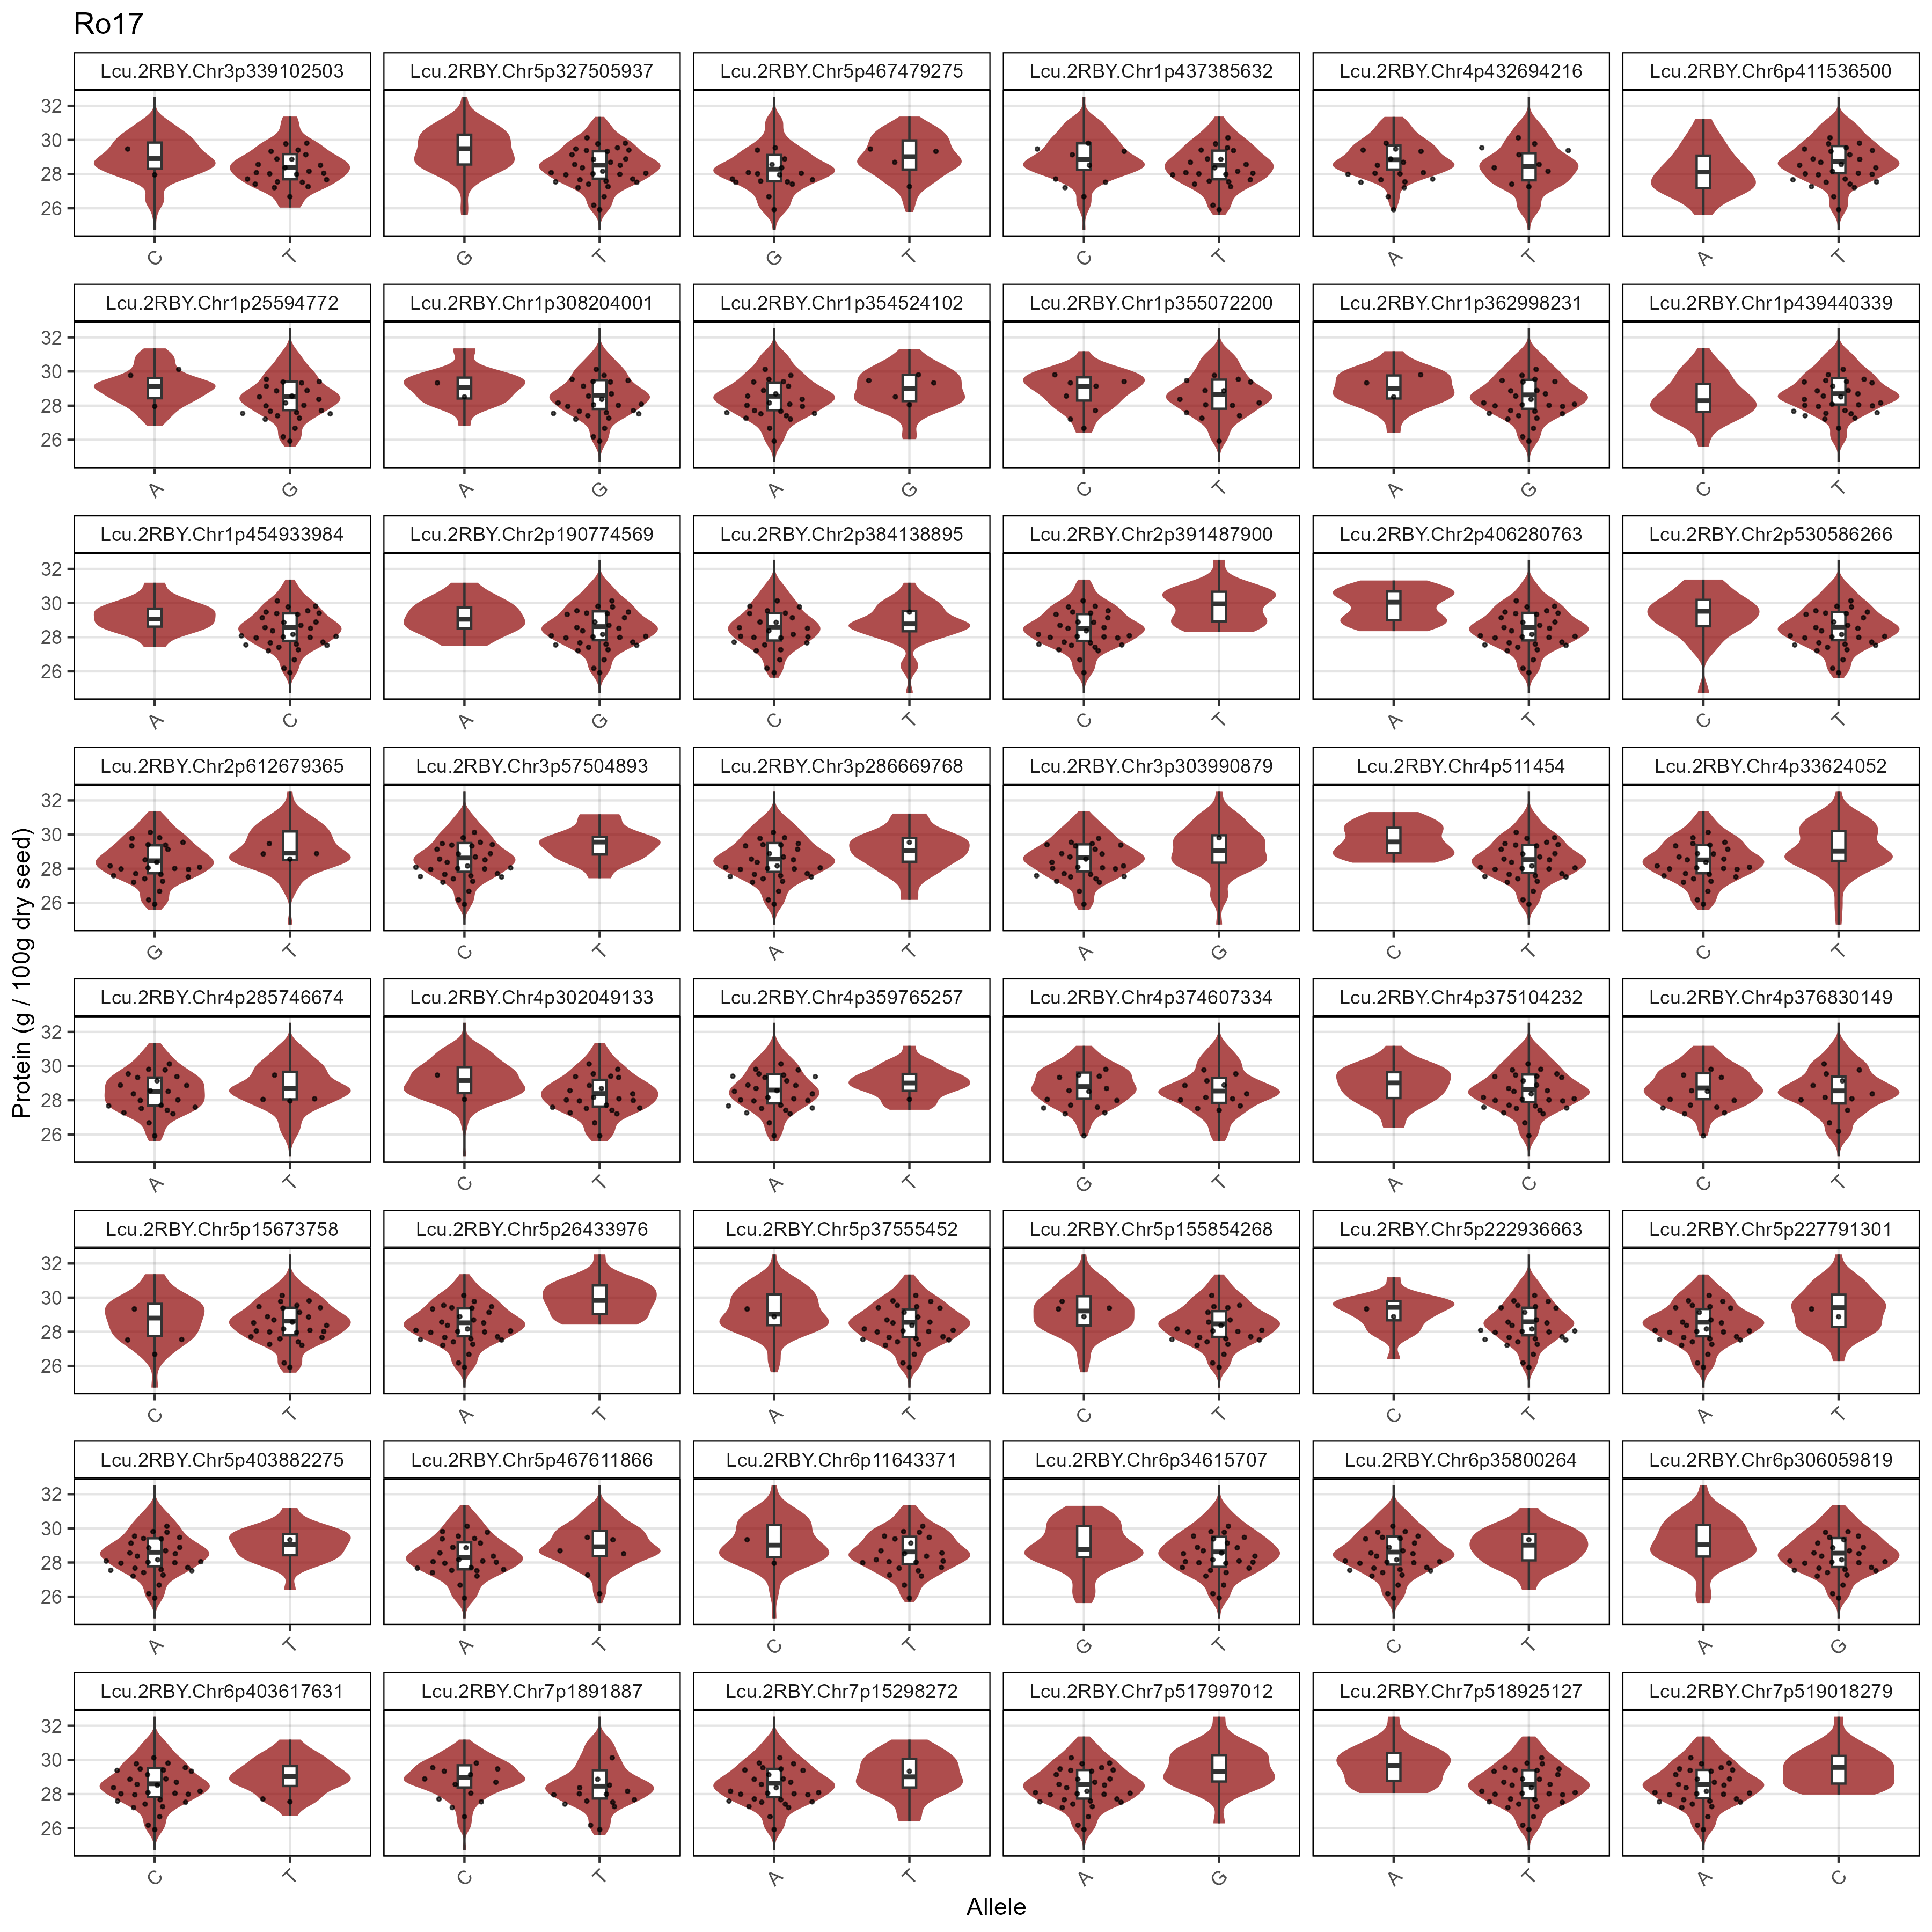
Additional Figures
Amino Acid Selections
- Additional/AA_Selections/Figure_03_01_Protein_Su16.html
- Additional/AA_Selections/Figure_03_02_Glutamate_Su16.html
- Additional/AA_Selections/Figure_03_03_Aspartate_Su16.html
- Additional/AA_Selections/Figure_03_04_Arginine_Su16.html
- Additional/AA_Selections/Figure_03_05_Leucine_Su16.html
- Additional/AA_Selections/Figure_03_06_Lysine_Su16.html
- Additional/AA_Selections/Figure_03_07_Phenylalanine_Su16.html
- Additional/AA_Selections/Figure_03_08_Serine_Su16.html
- Additional/AA_Selections/Figure_03_09_Valine_Su16.html
- Additional/AA_Selections/Figure_03_10_Isoleucine_Su16.html
- Additional/AA_Selections/Figure_03_11_Proline_Su16.html
- Additional/AA_Selections/Figure_03_12_Alanine_Su16.html
- Additional/AA_Selections/Figure_03_13_Glycine_Su16.html
- Additional/AA_Selections/Figure_03_14_Threonine_Su16.html
- Additional/AA_Selections/Figure_03_15_Histidine_Su16.html
- Additional/AA_Selections/Figure_03_16_Tyrosine_Su16.html
- Additional/AA_Selections/Figure_03_17_Methionine_Su16.html
- Additional/AA_Selections/Figure_03_18_Cysteine_Su16.html
- Additional/AA_Selections/Figure_03_19_Tryptophan_Su16.html
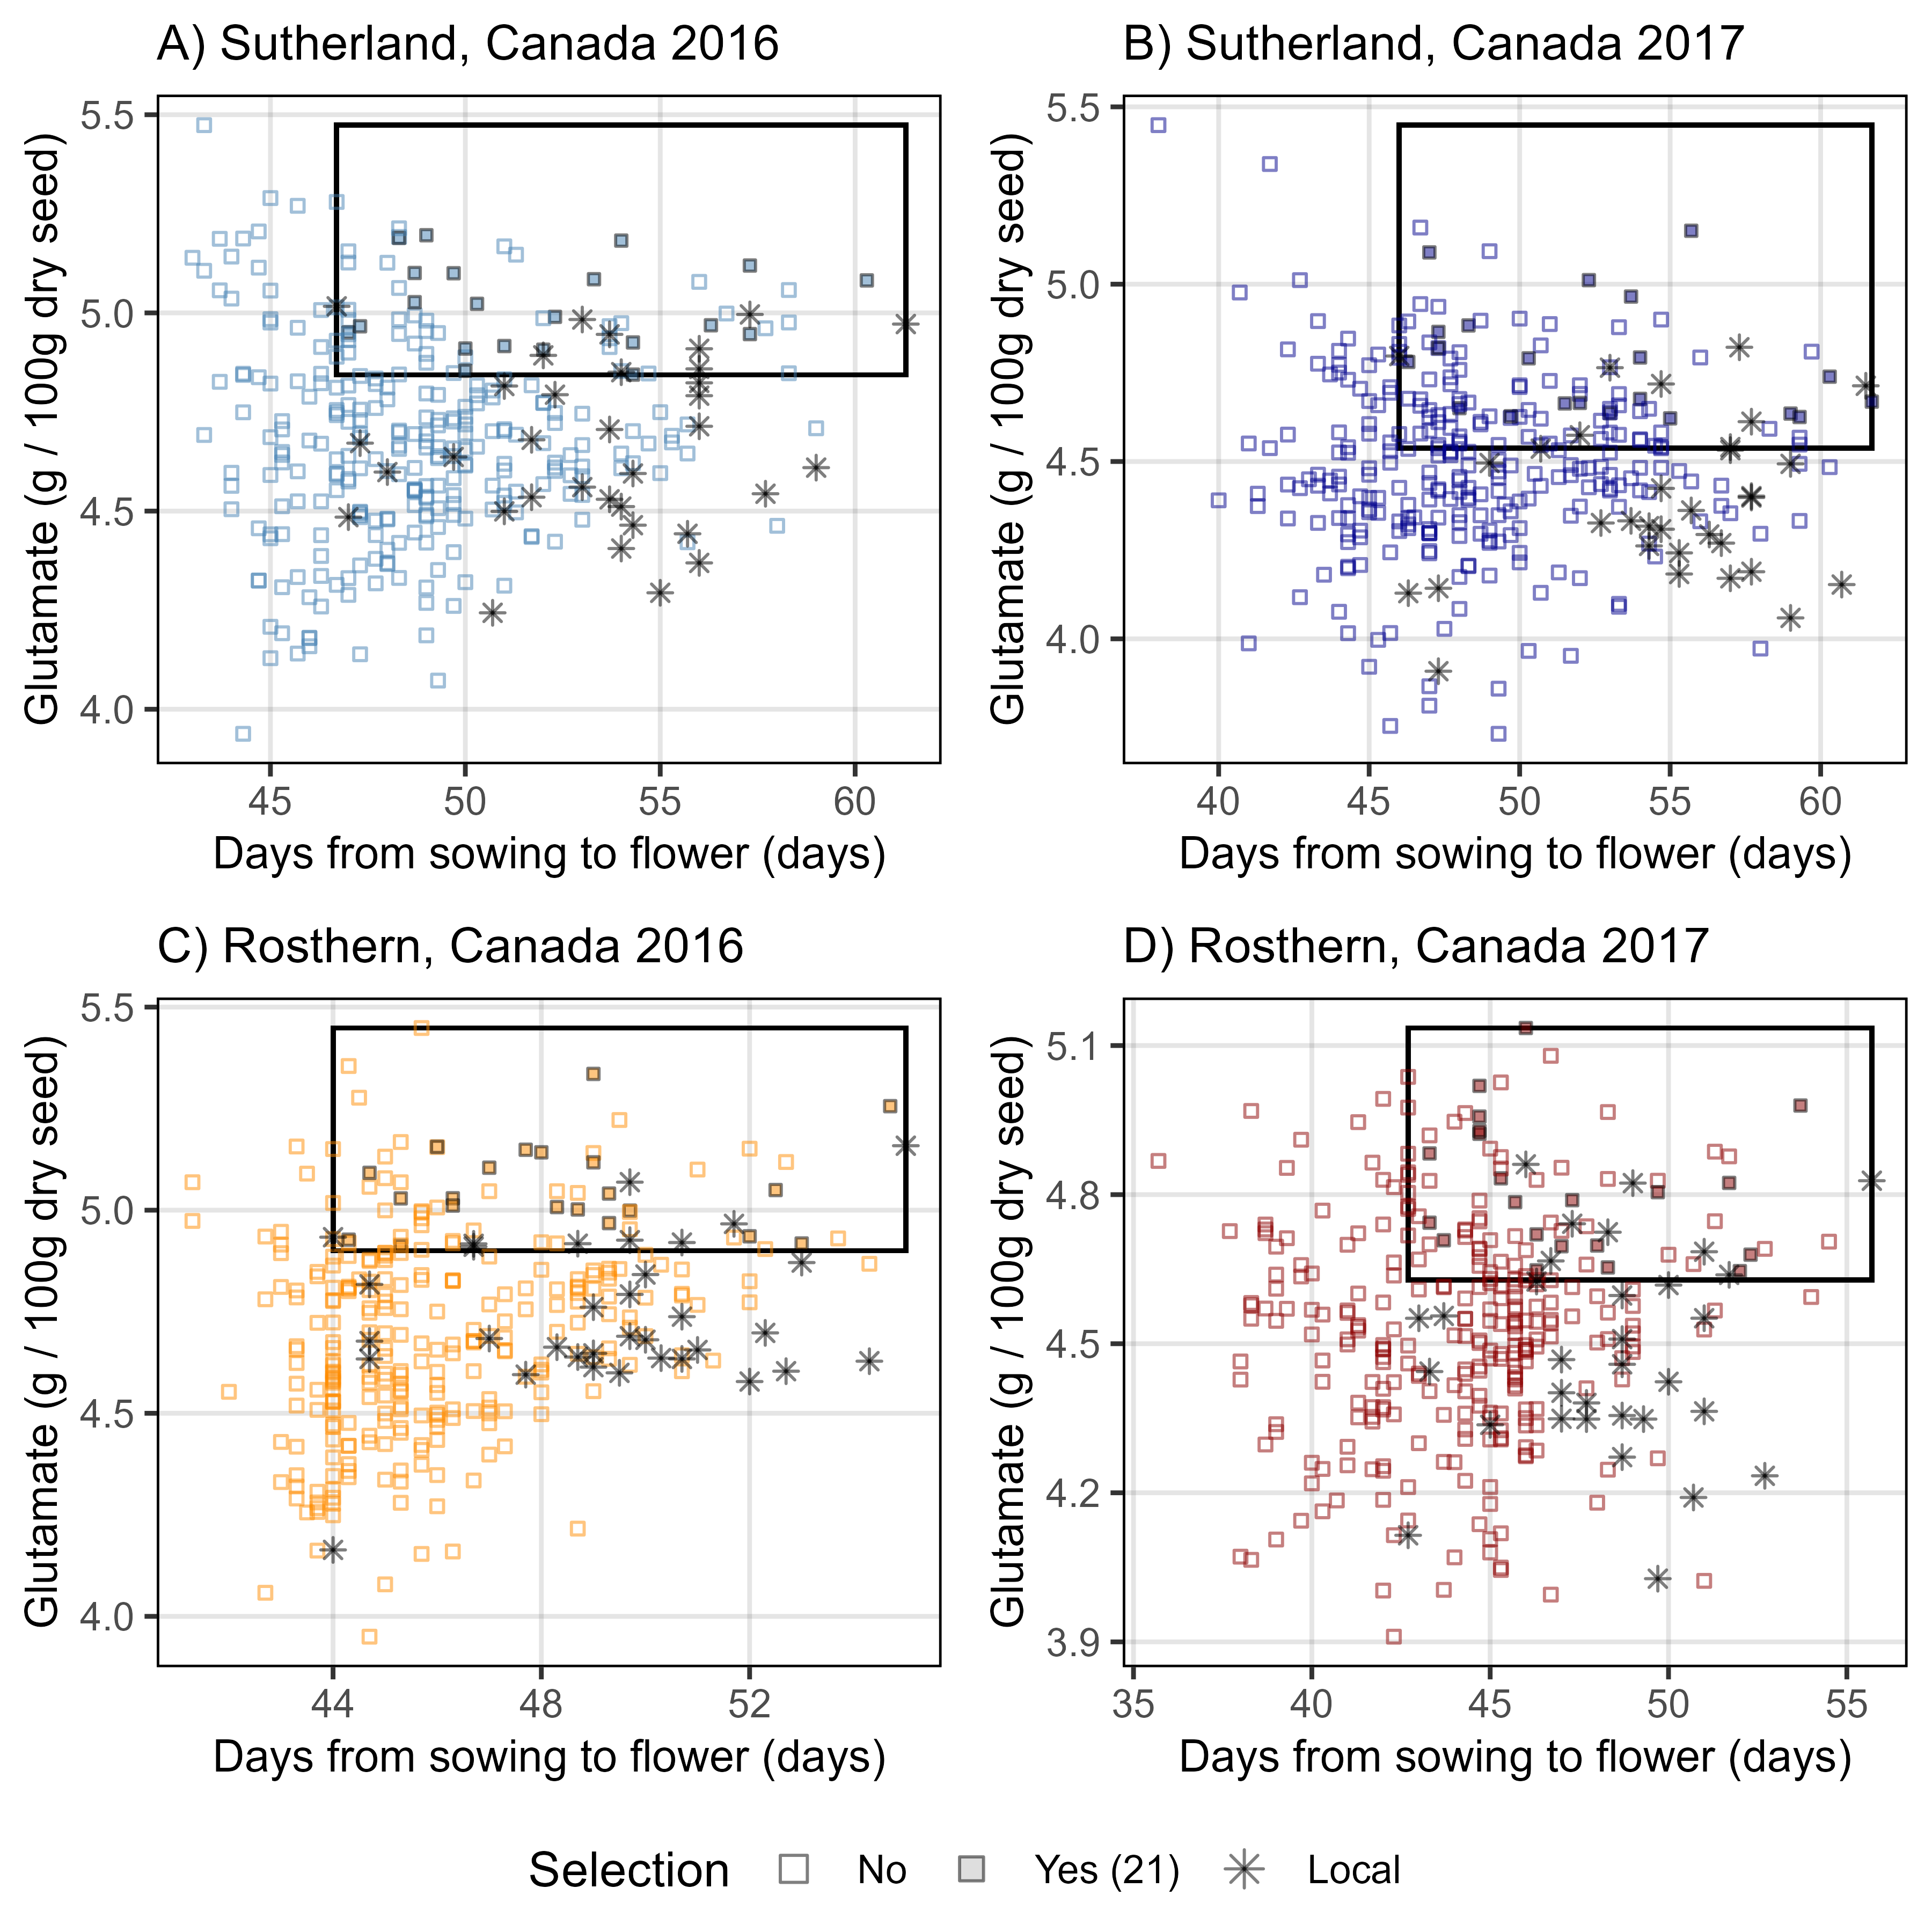
Additional Figure 1
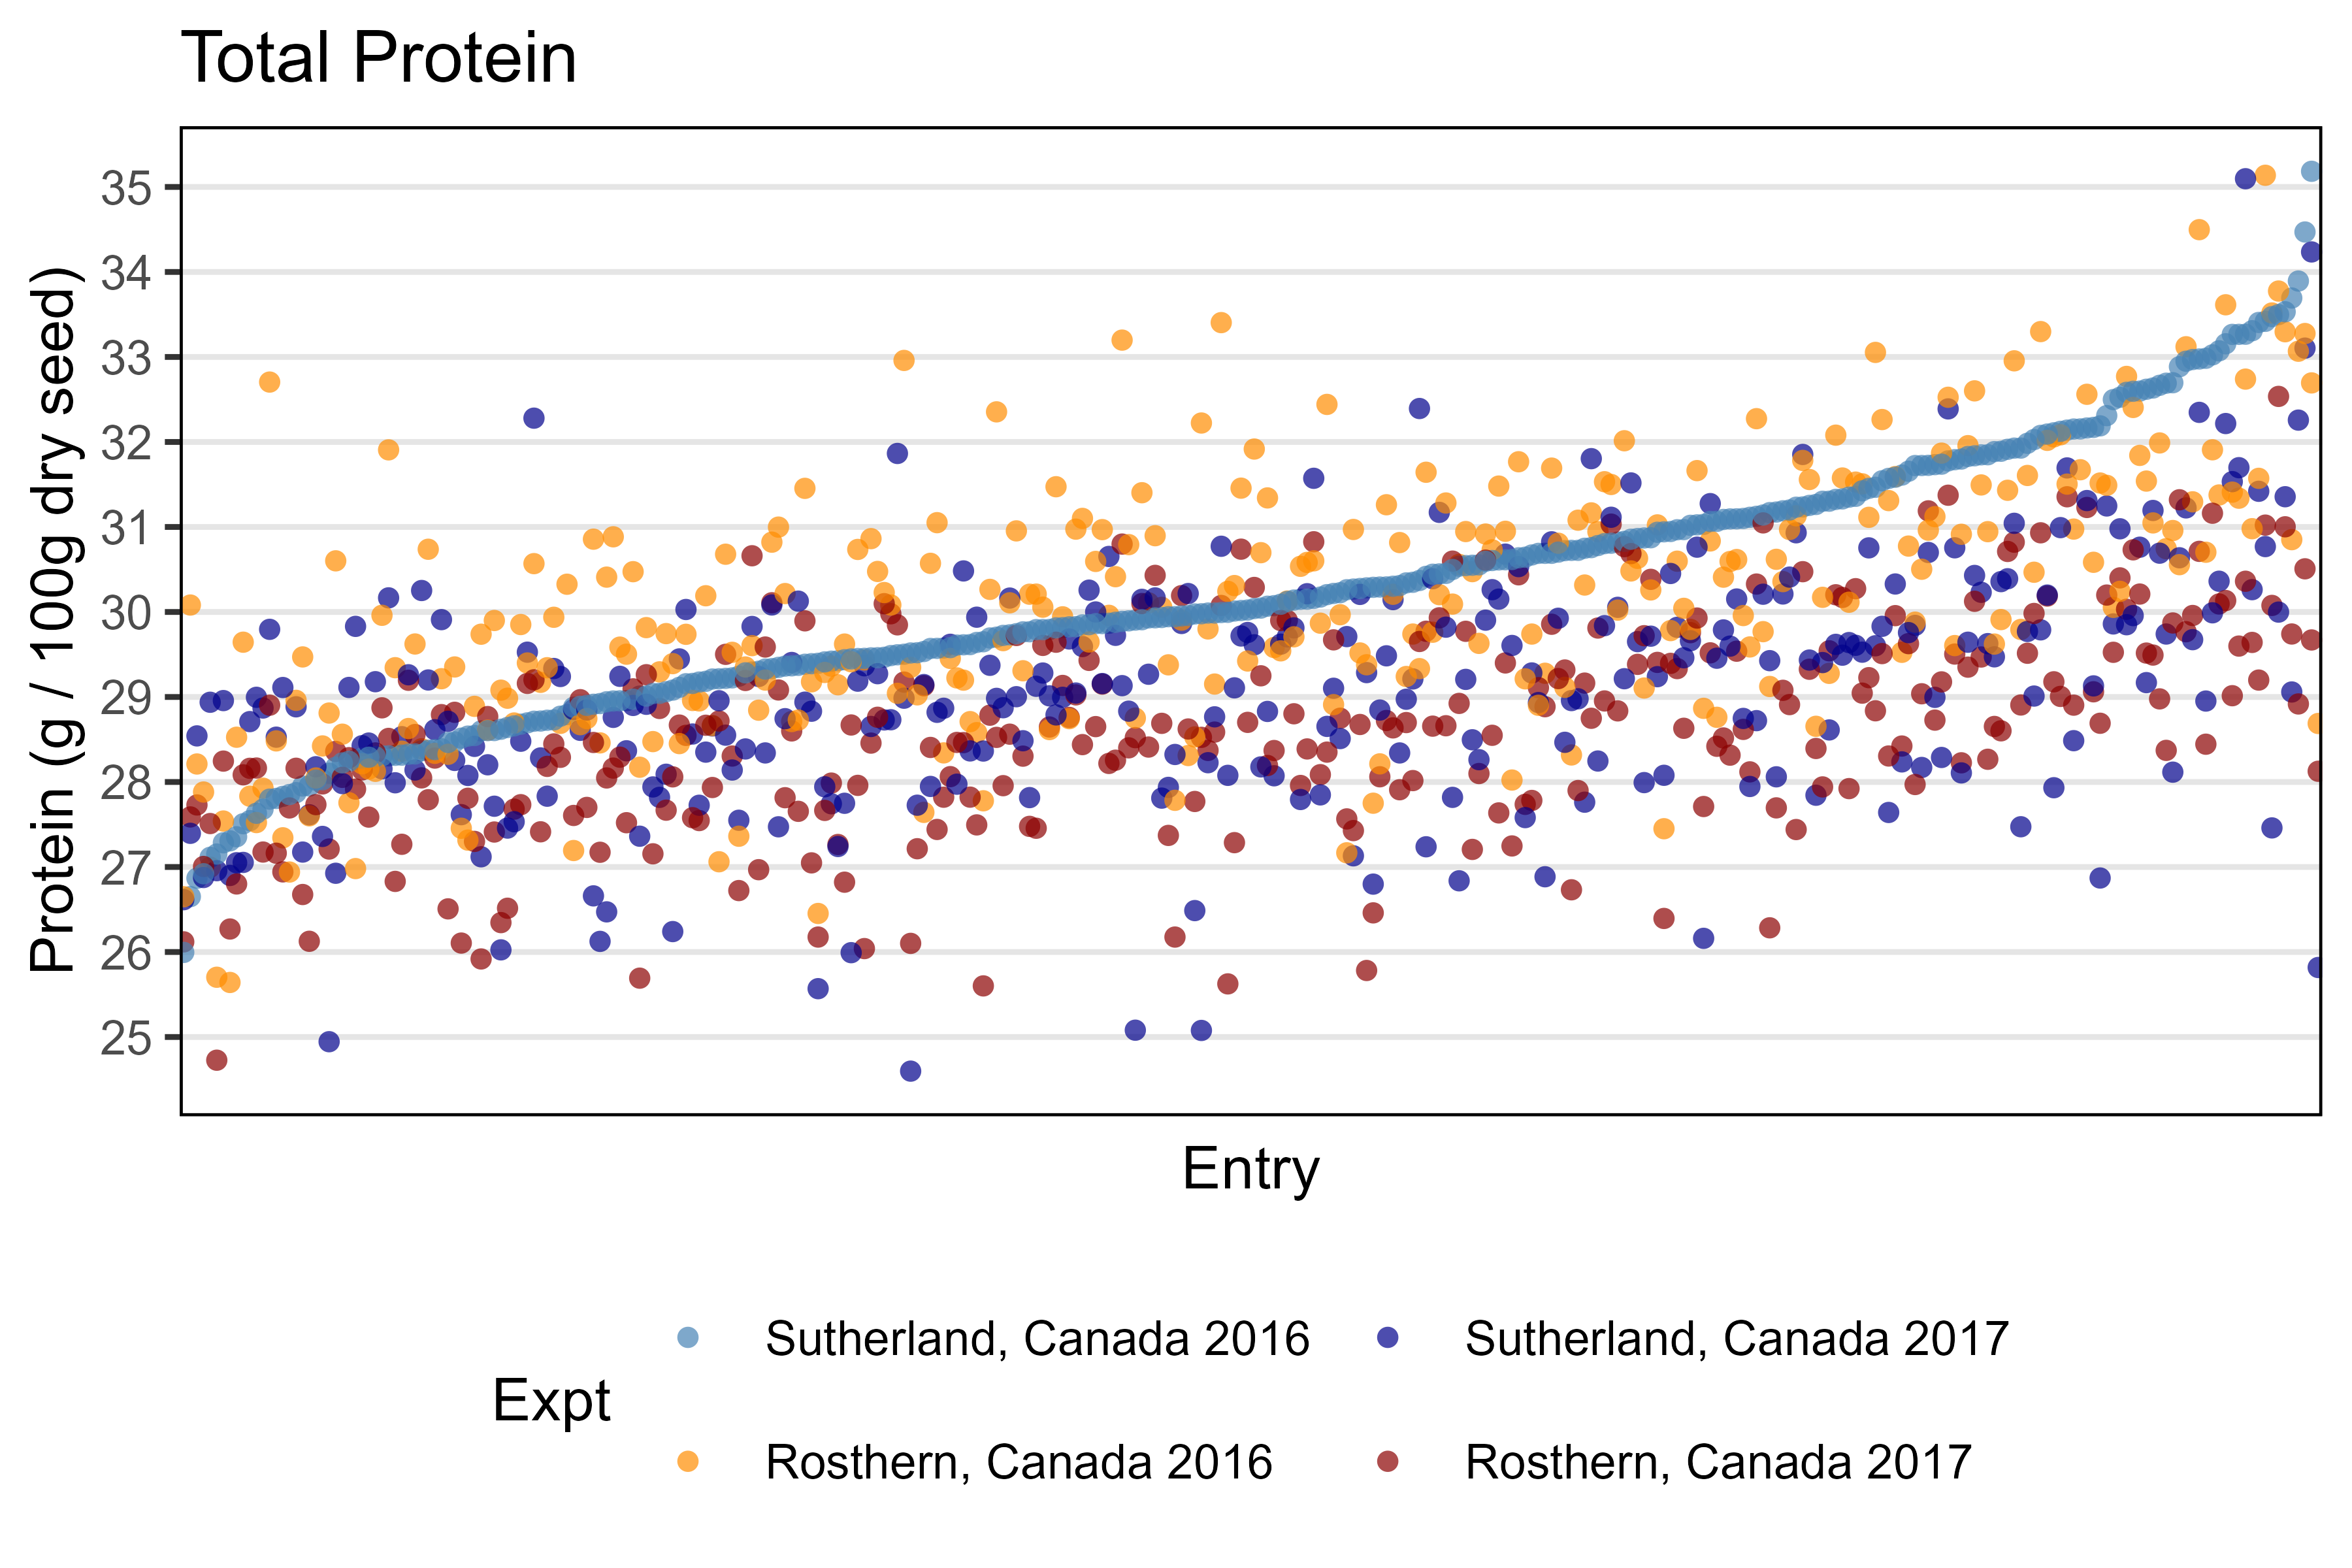
Additional Figure 2
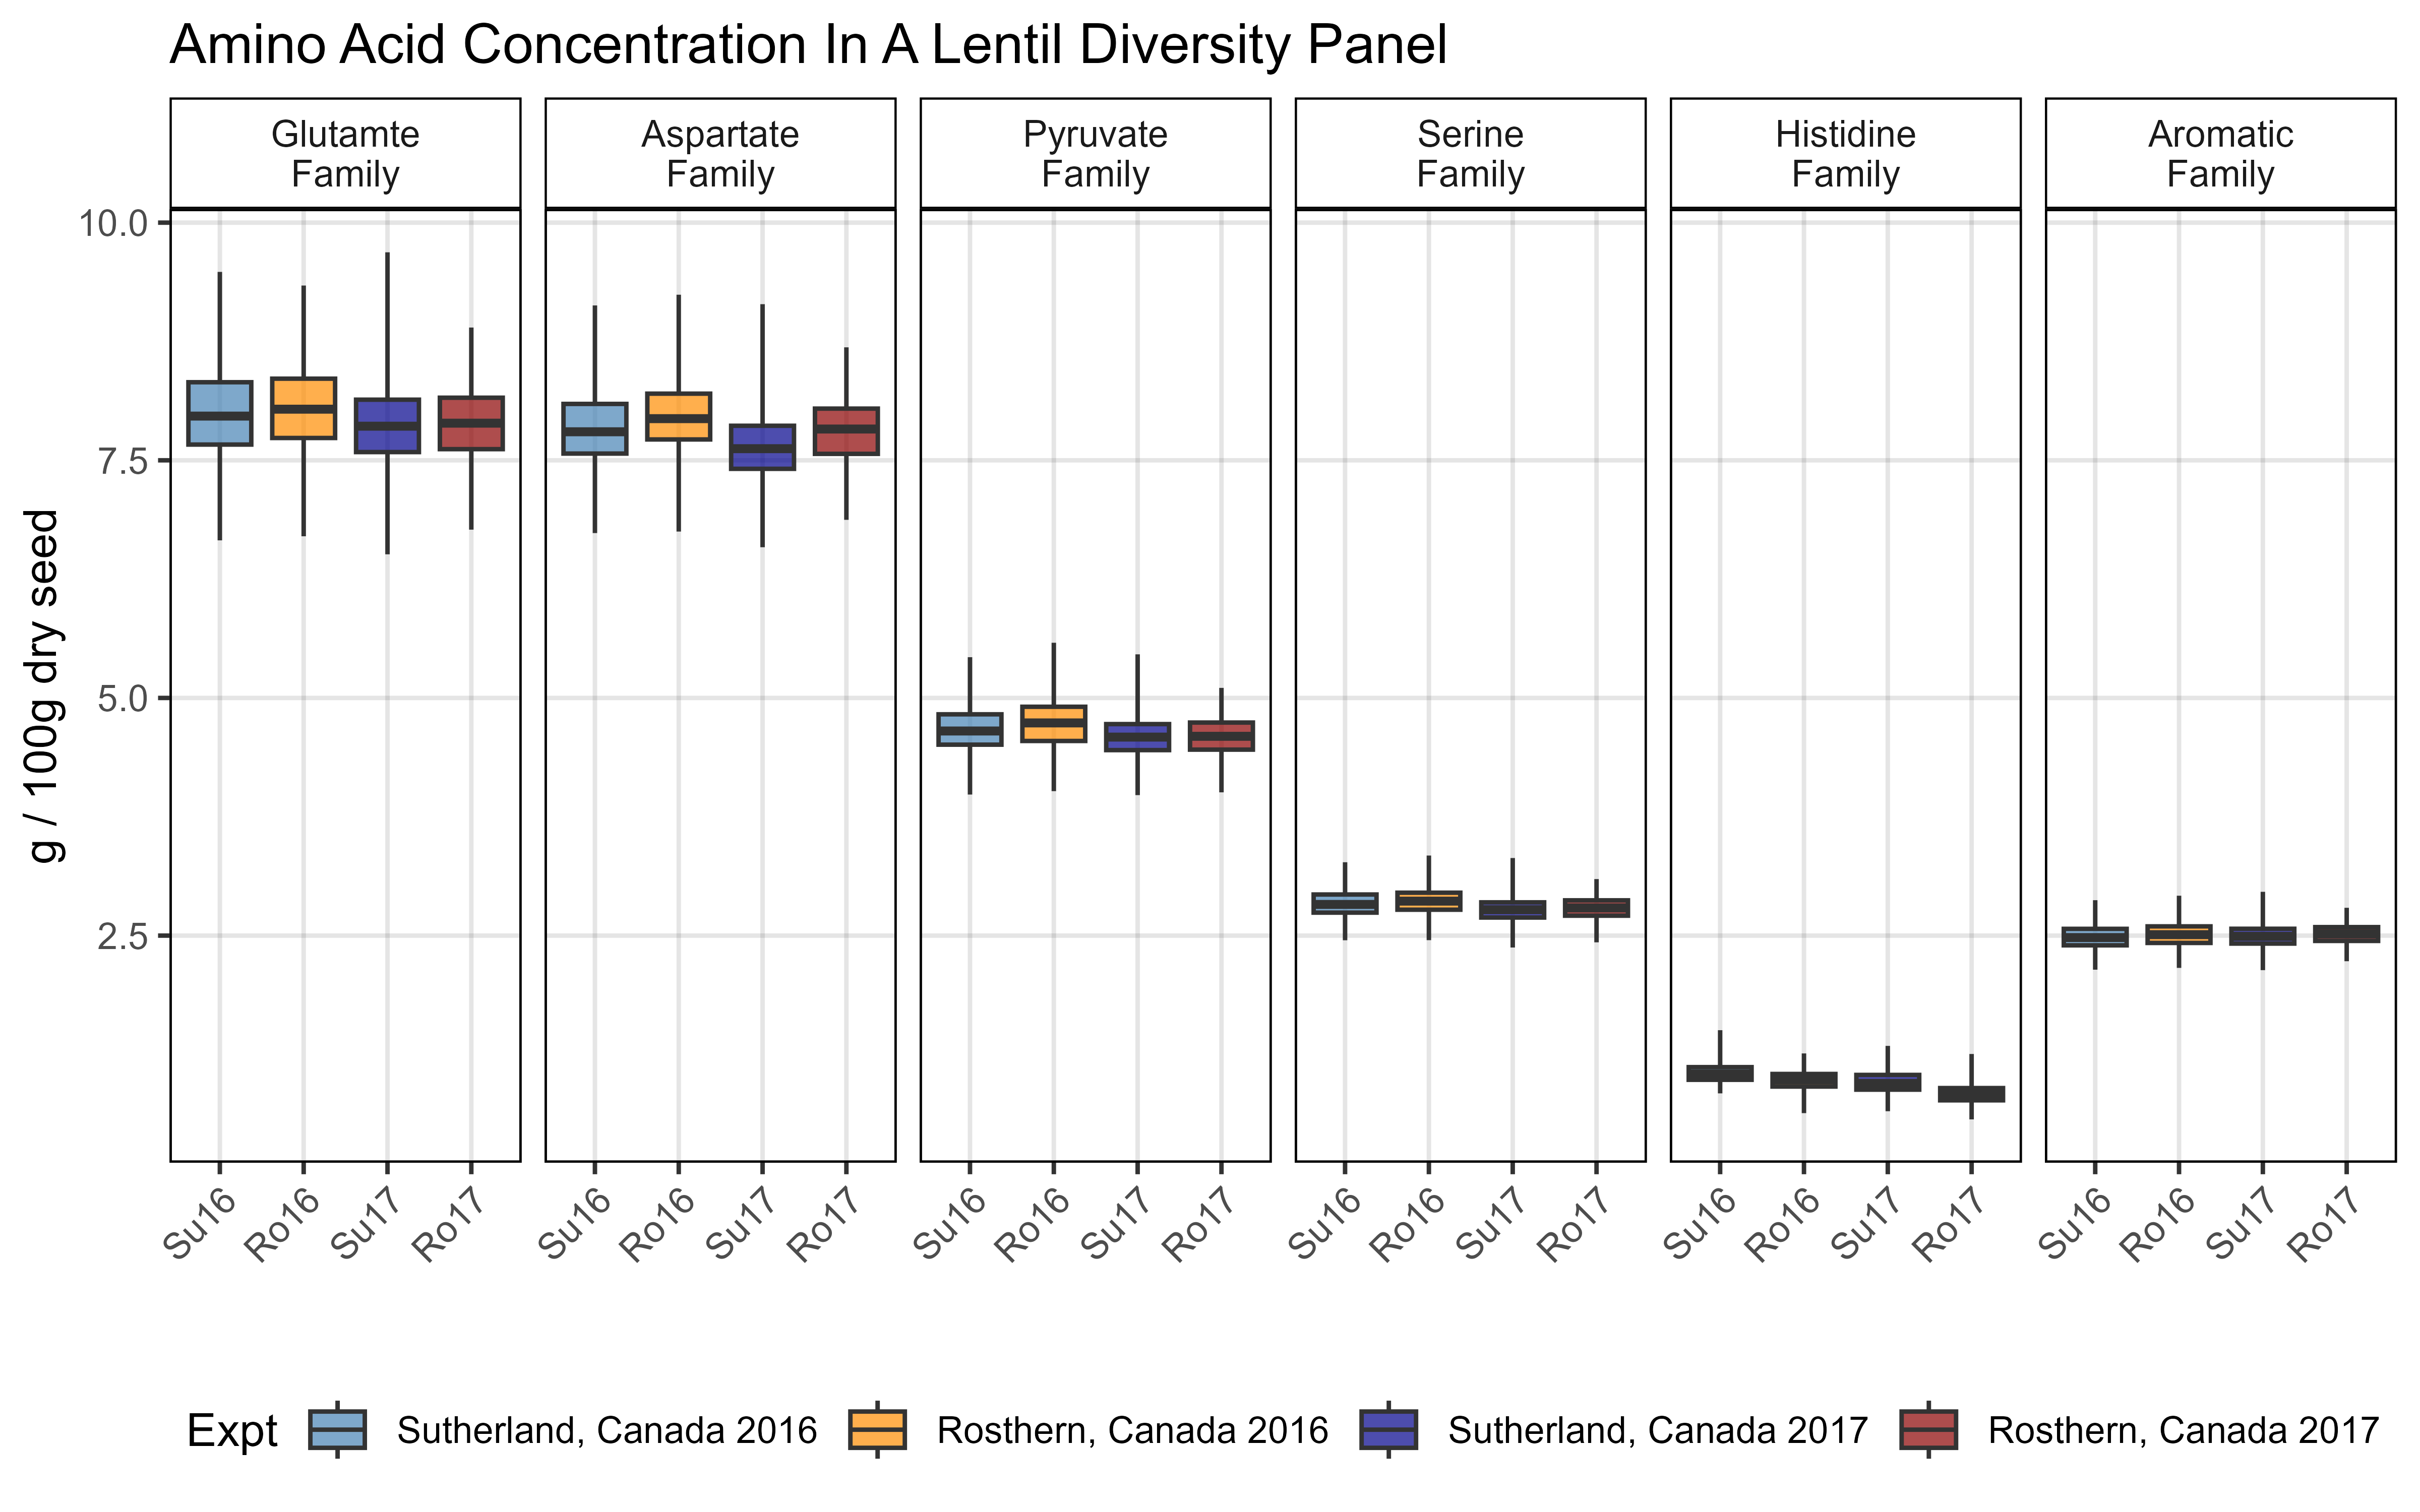
Additional Figure 3

Additional Figure 4
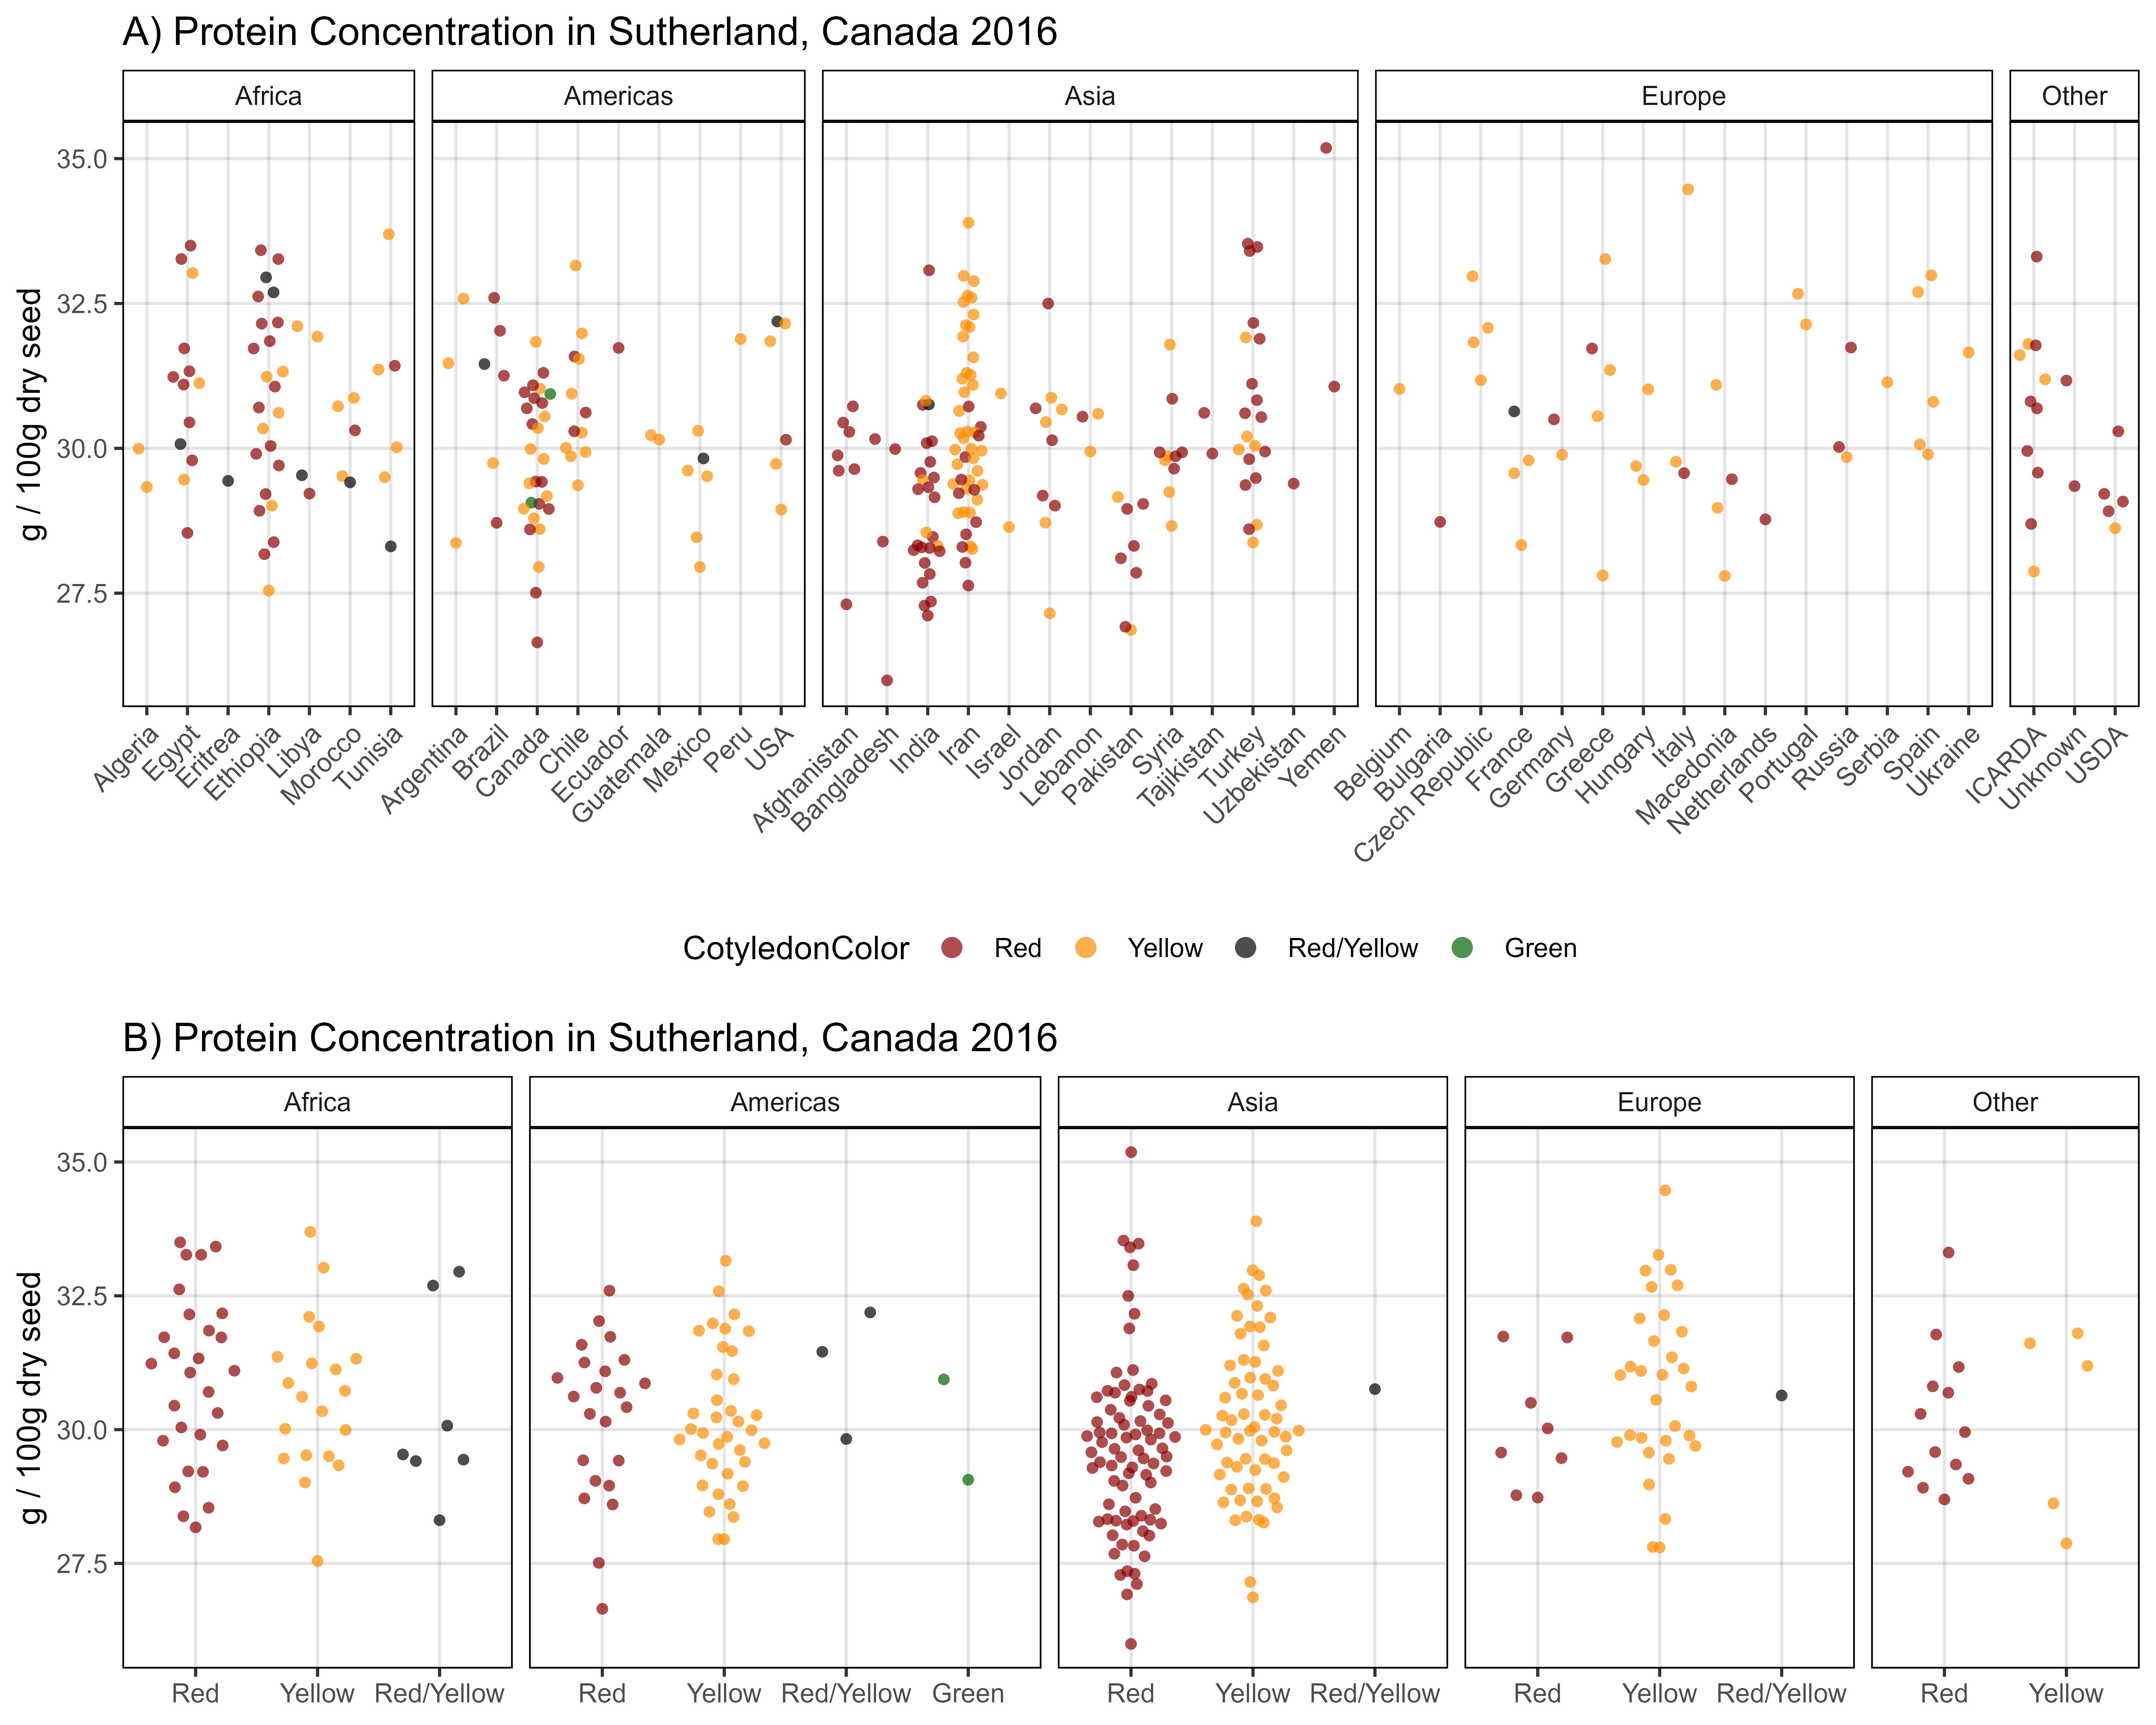
Additional Figure 5

Additional Figure 7
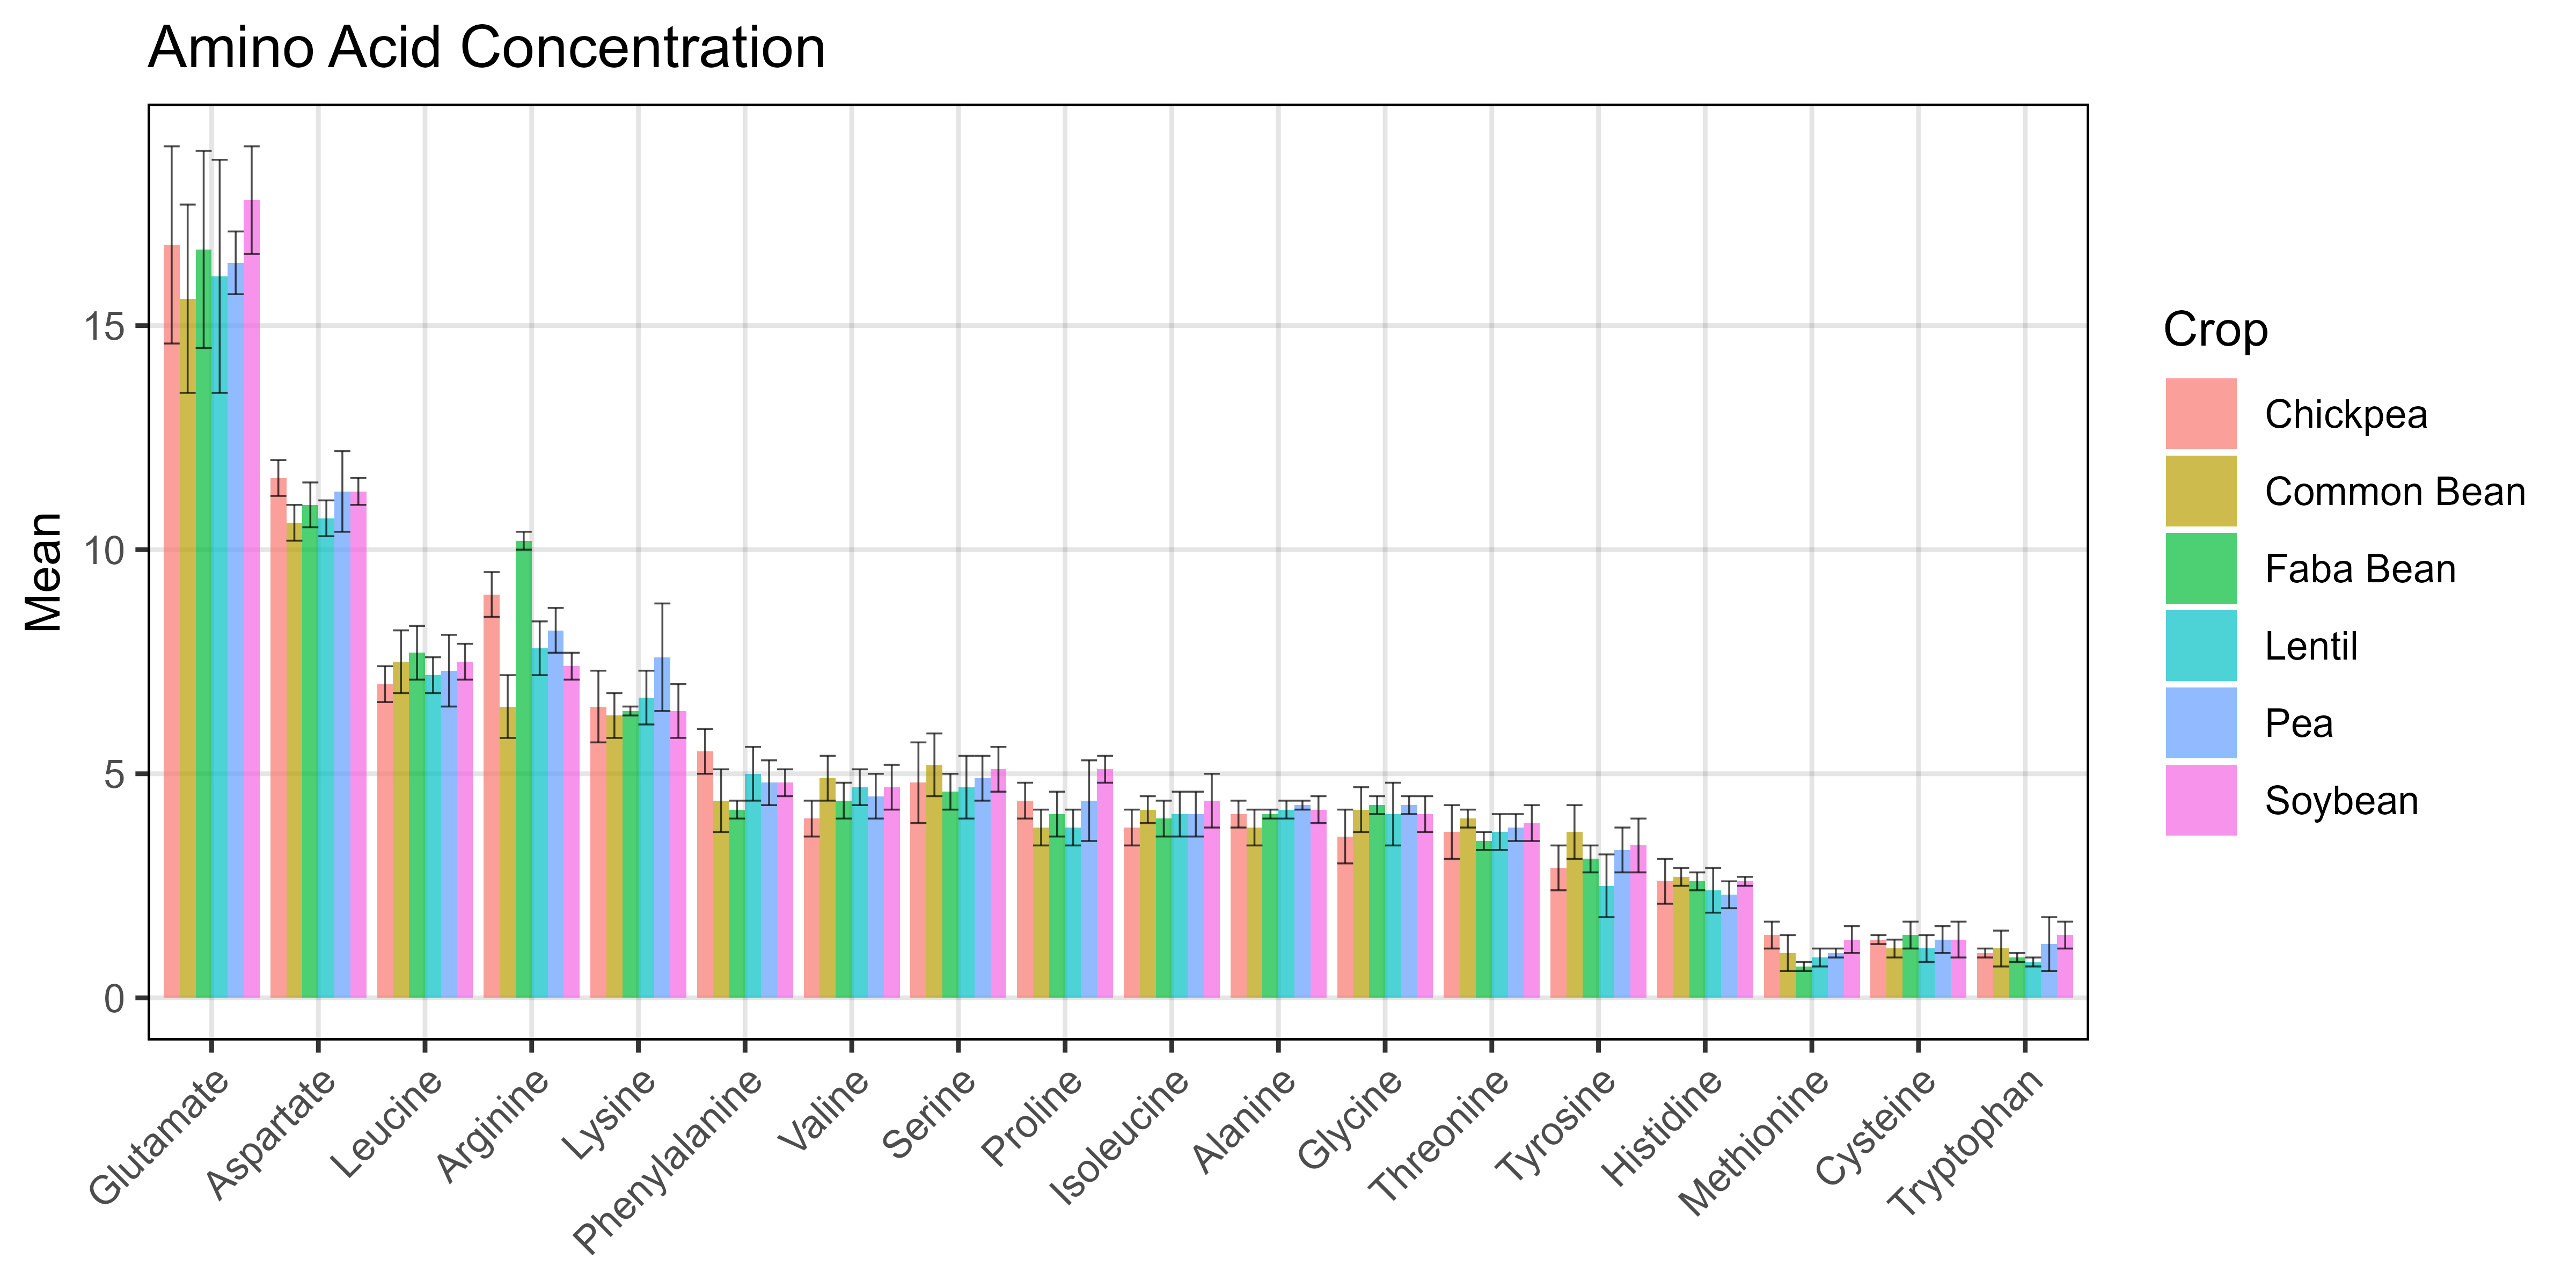
Additional Figure 8
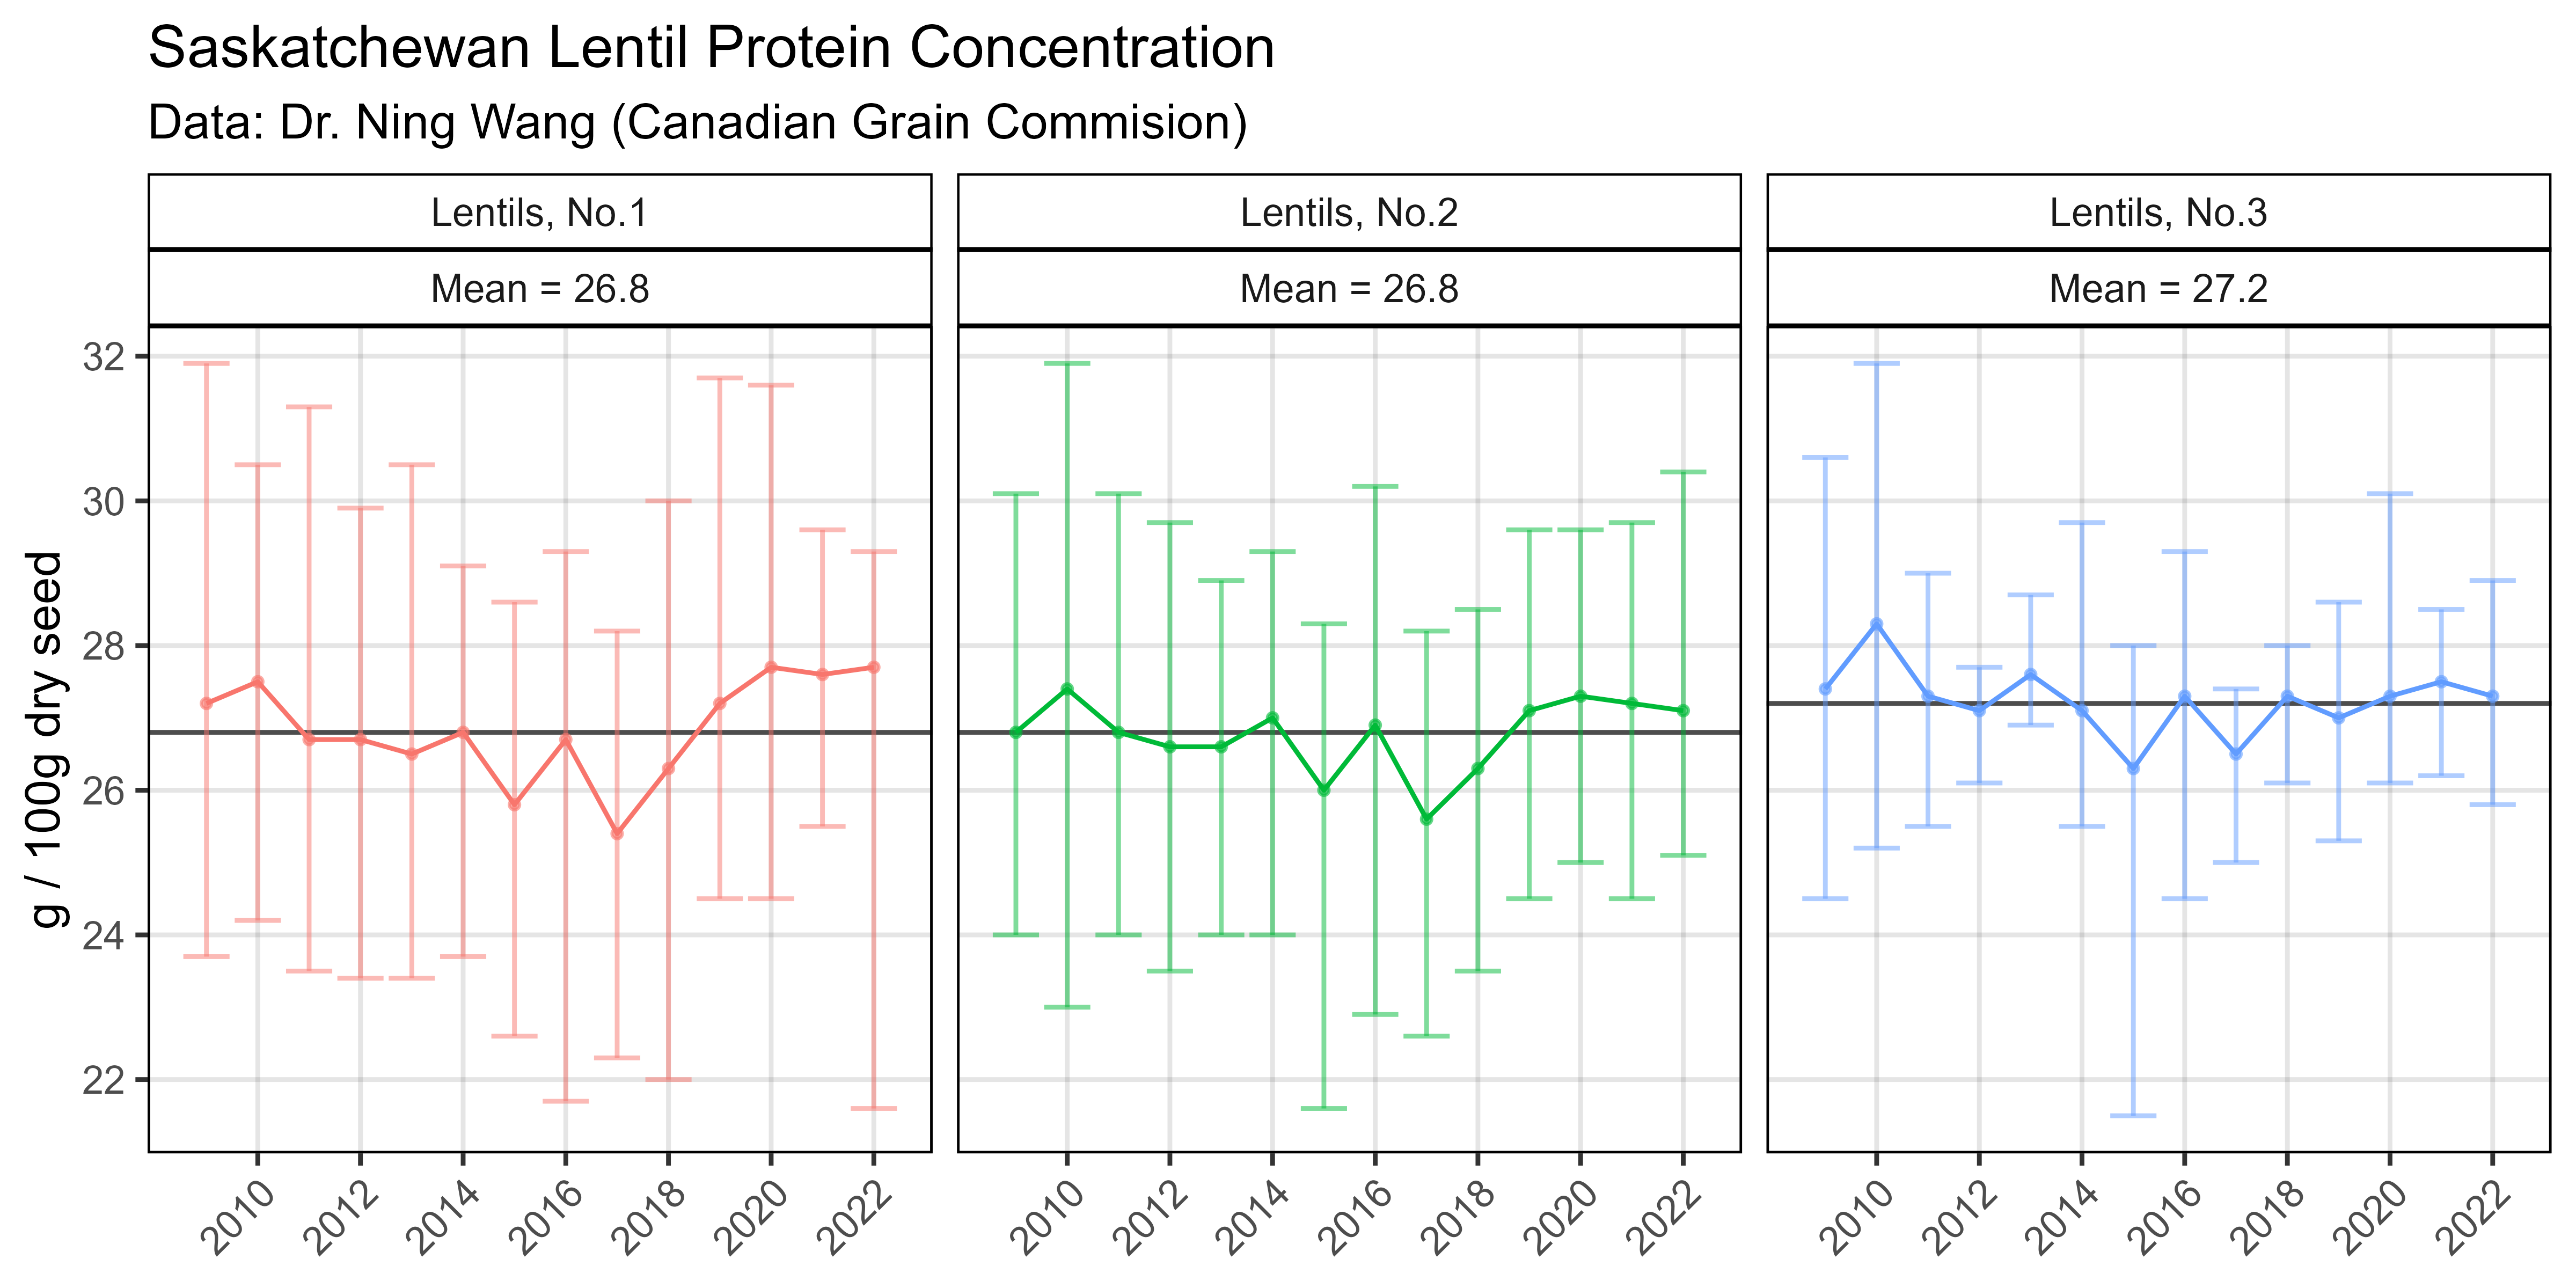
Additional Figure 9
© Derek Michael Wright


