gg_Manhattan_xTraits()
2.3_gg_Manhattan_xTraits.RmdUses multiple GWAS models and facets each trait.
The function gg_Manhattan_xTraits() creates manhattan
plots from GAPIT GWAS results for multiple traits and facets them by
Trait.
Specifying a folder and traits is all that
is needed to create manhattan plots for multiple traits.
# Plot
mp <- gg_Manhattan_xTraits(
  # Specify a folder with GWAS results
  folder = "GWAS_Results/",
  # Select traits to plot
  traits = c("DTF_Nepal_2017", "DTF_Sask_2017", "DTF_Sask_2017_b") )
# Save
ggsave("figures/gg_Manhattan_xTraits_01.png", mp, width = 12, height = 8, bg = "white")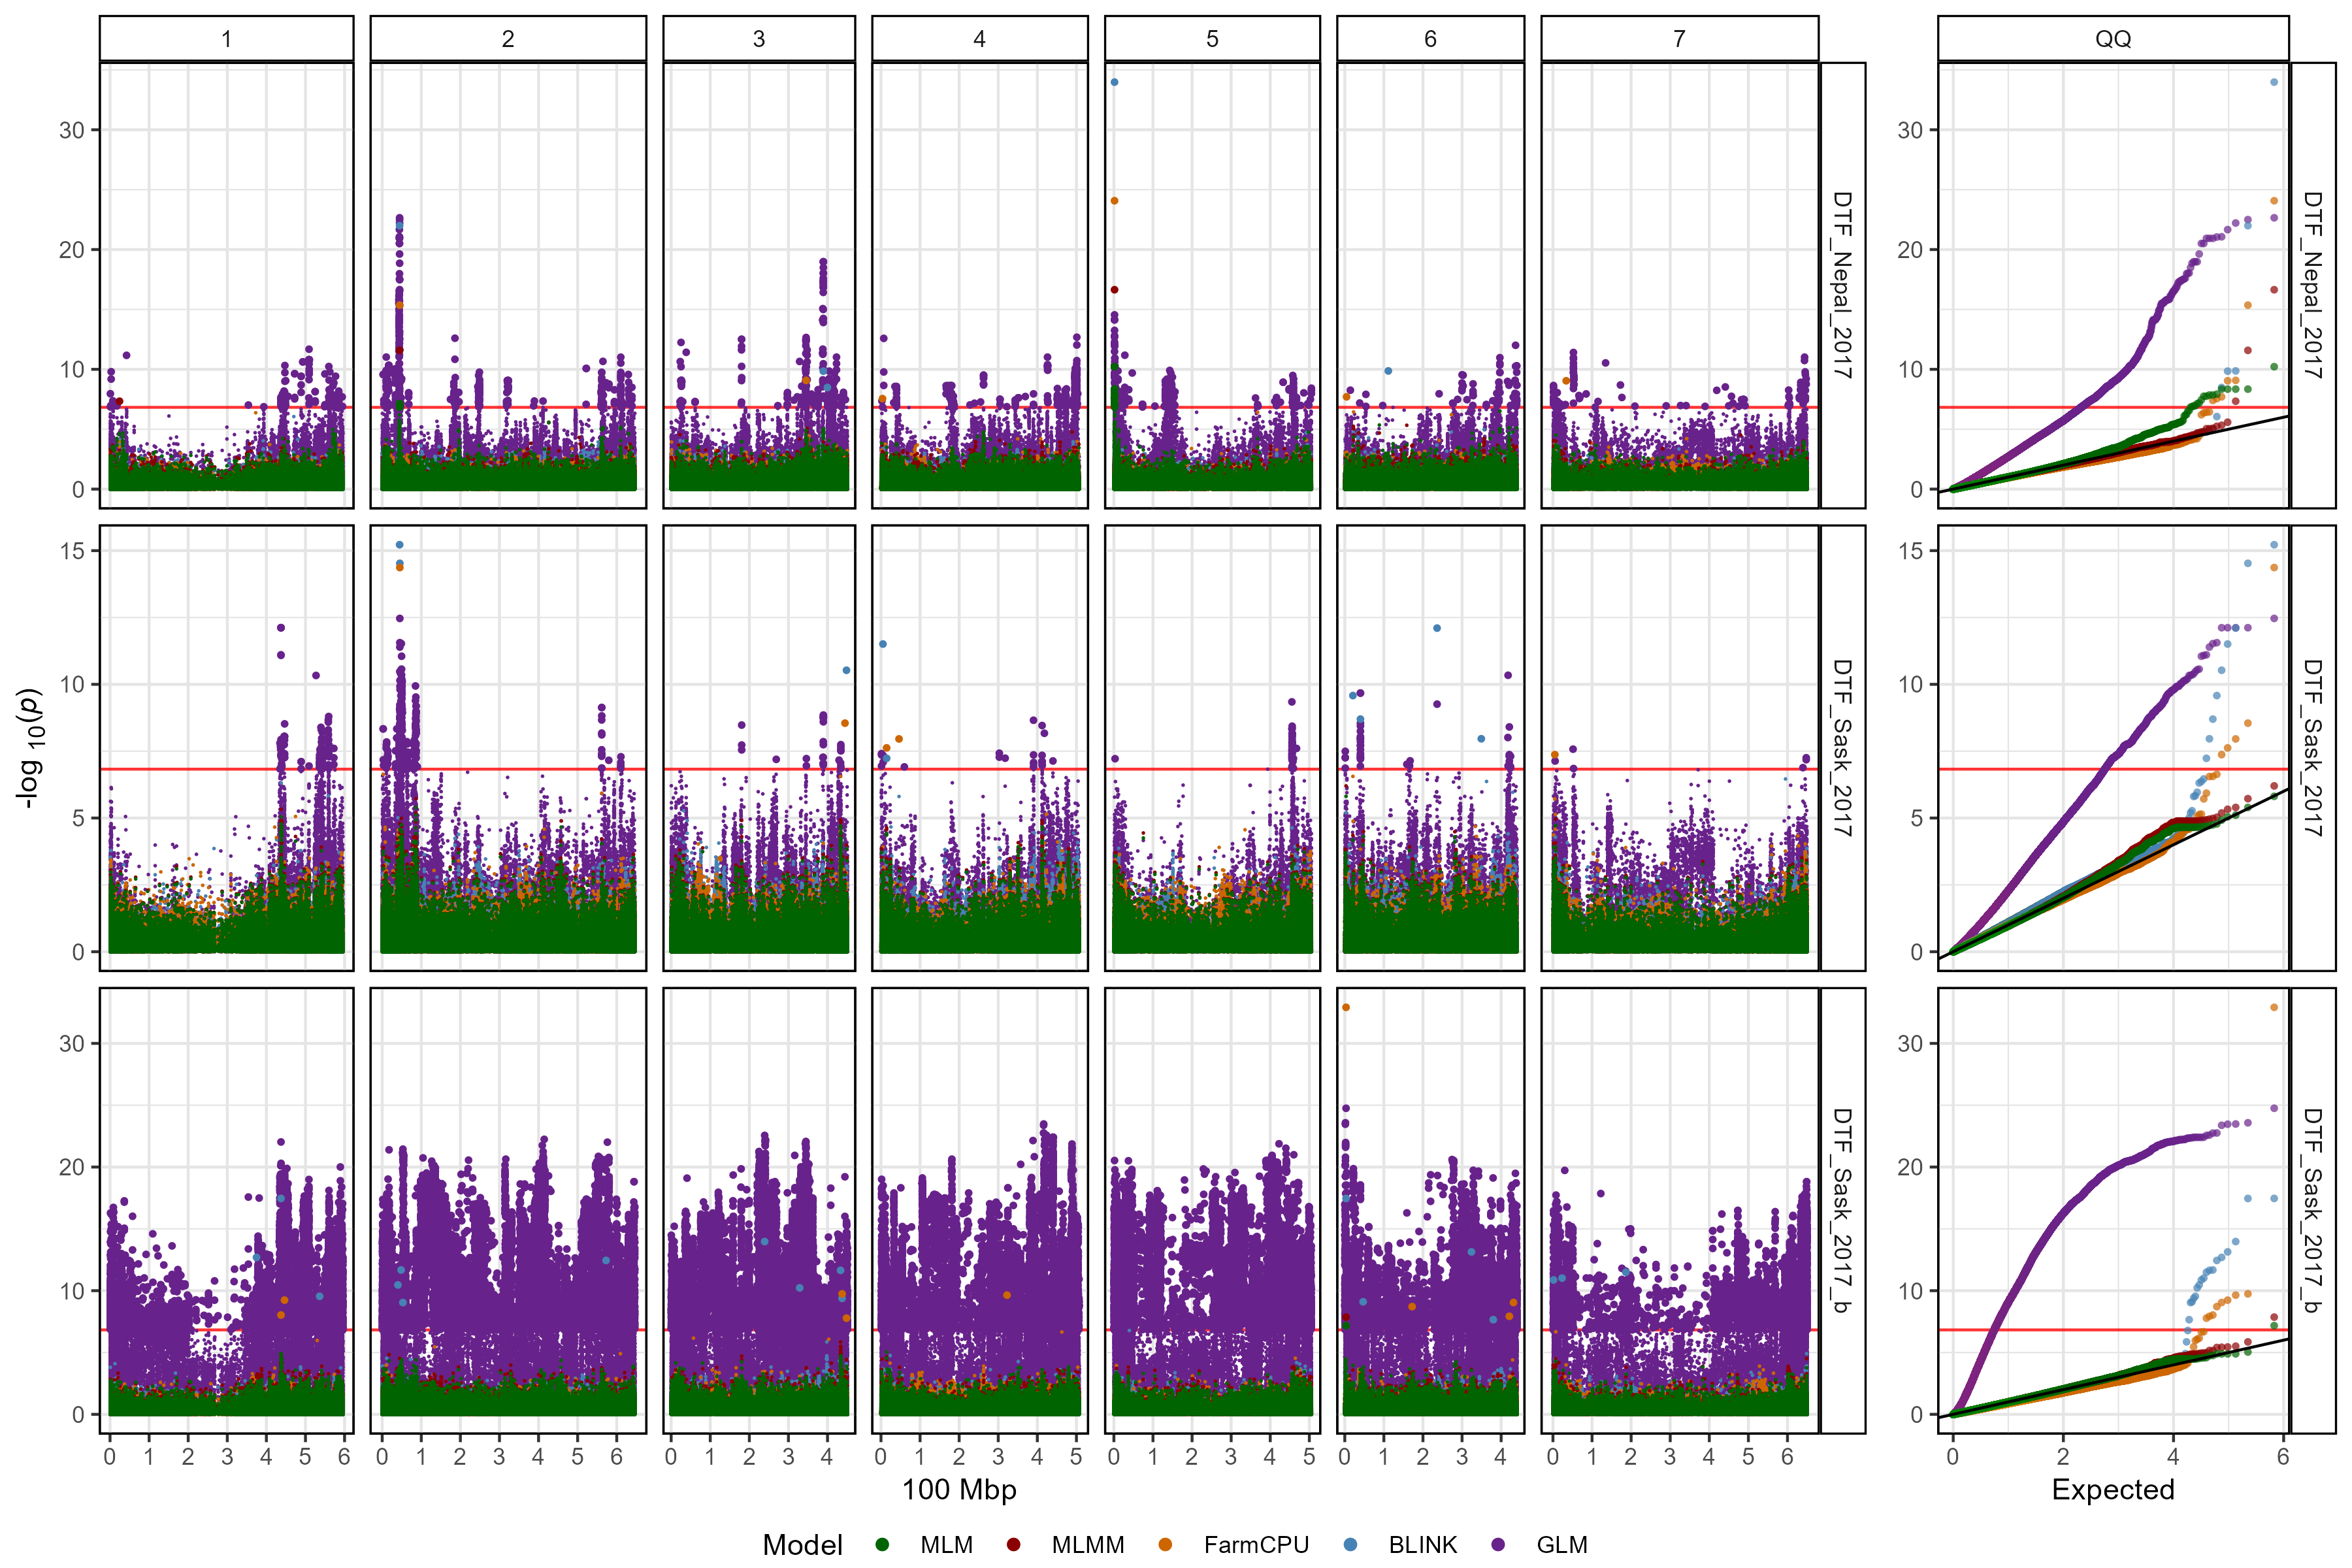
Customized Plot
# Plot
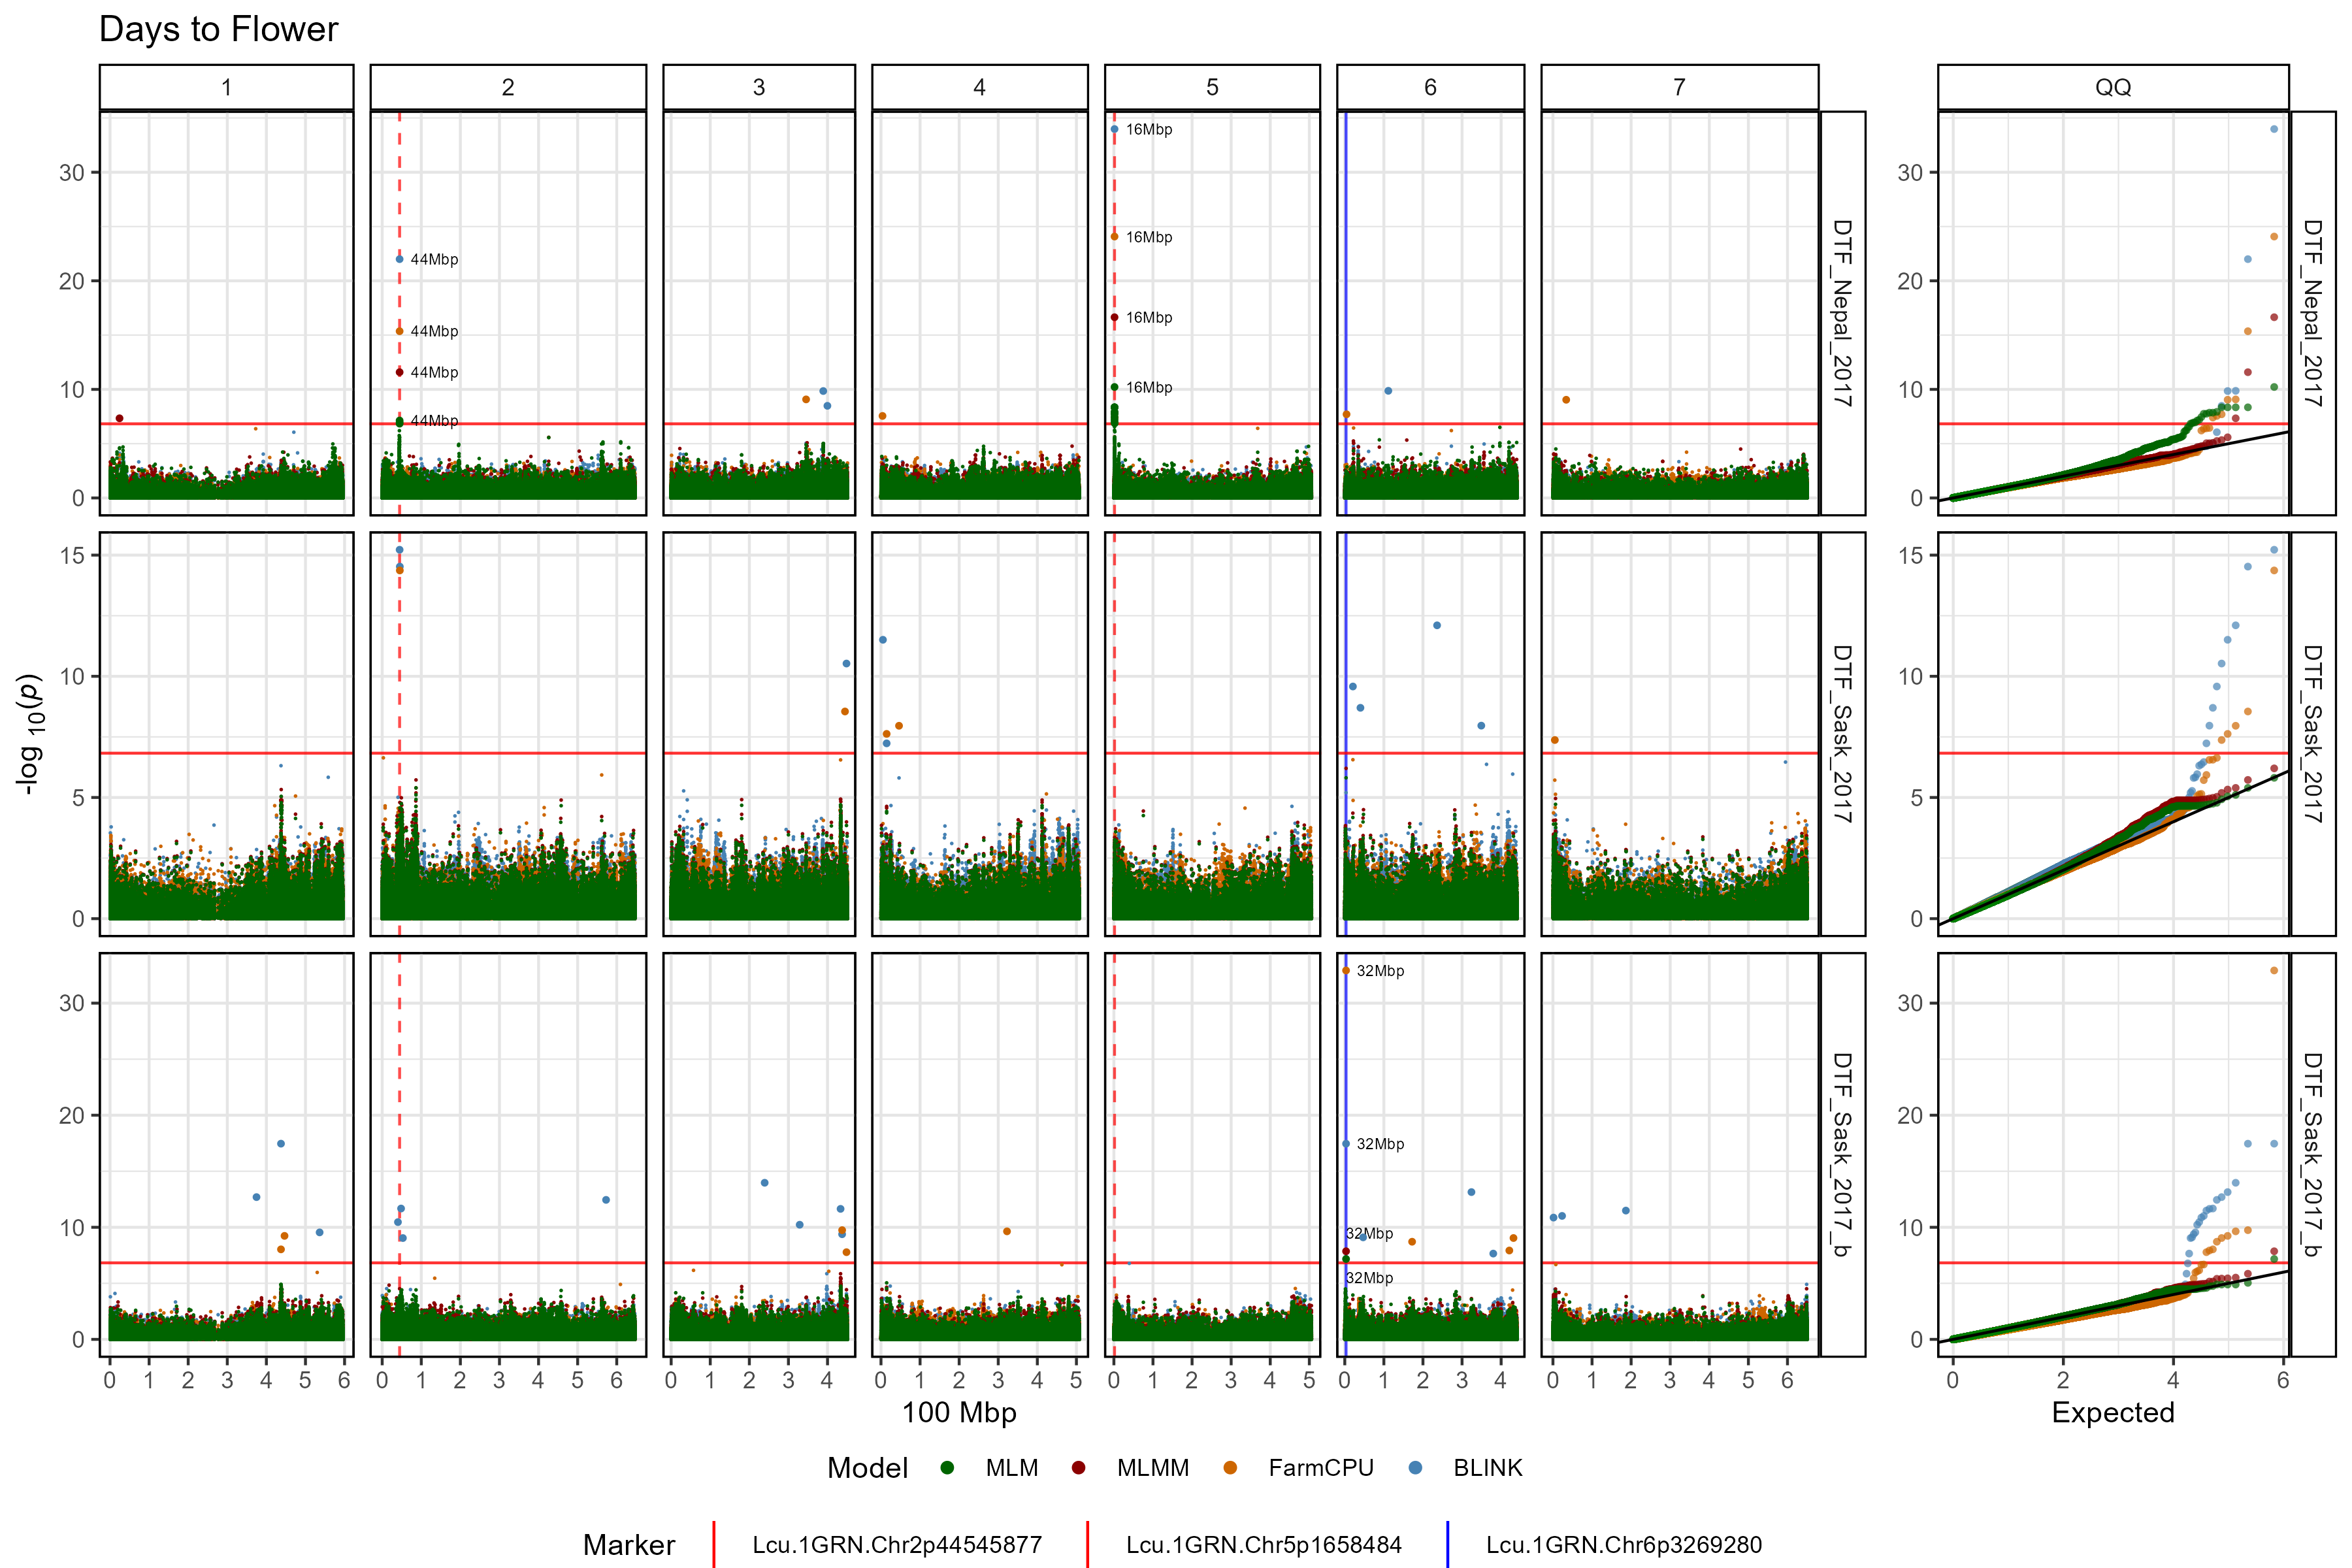
mp <- gg_Manhattan_xTraits(
  # Specify a folder with GWAS results
  folder = "GWAS_Results/",
  # Select traits to plot
  traits = c("DTF_Nepal_2017", "DTF_Sask_2017", "DTF_Sask_2017_b"),
  # Specify a title
  title = "Days to Flower",
  # Highlight specific markers
  markers = c("Lcu.1GRN.Chr2p44545877",
              "Lcu.1GRN.Chr5p1658484",
              "Lcu.1GRN.Chr6p3269280"),
  # Create alt labels for the markers
  labels = c("44Mbp","16Mbp","32Mbp"),
  # Specify Color for each marker vline
  vline.colors = c("red","red","blue"),
  vline.types = c(2,2,1),
  # Change the legend alignment
  legend.box="vertical",
  # Specify GWAS models to plot
  models =  c("MLM","MLMM","FarmCPU","BLINK") )
# Save
ggsave("figures/gg_Manhattan_xTraits_02.png", mp, width = 12, height = 8, bg = "white")