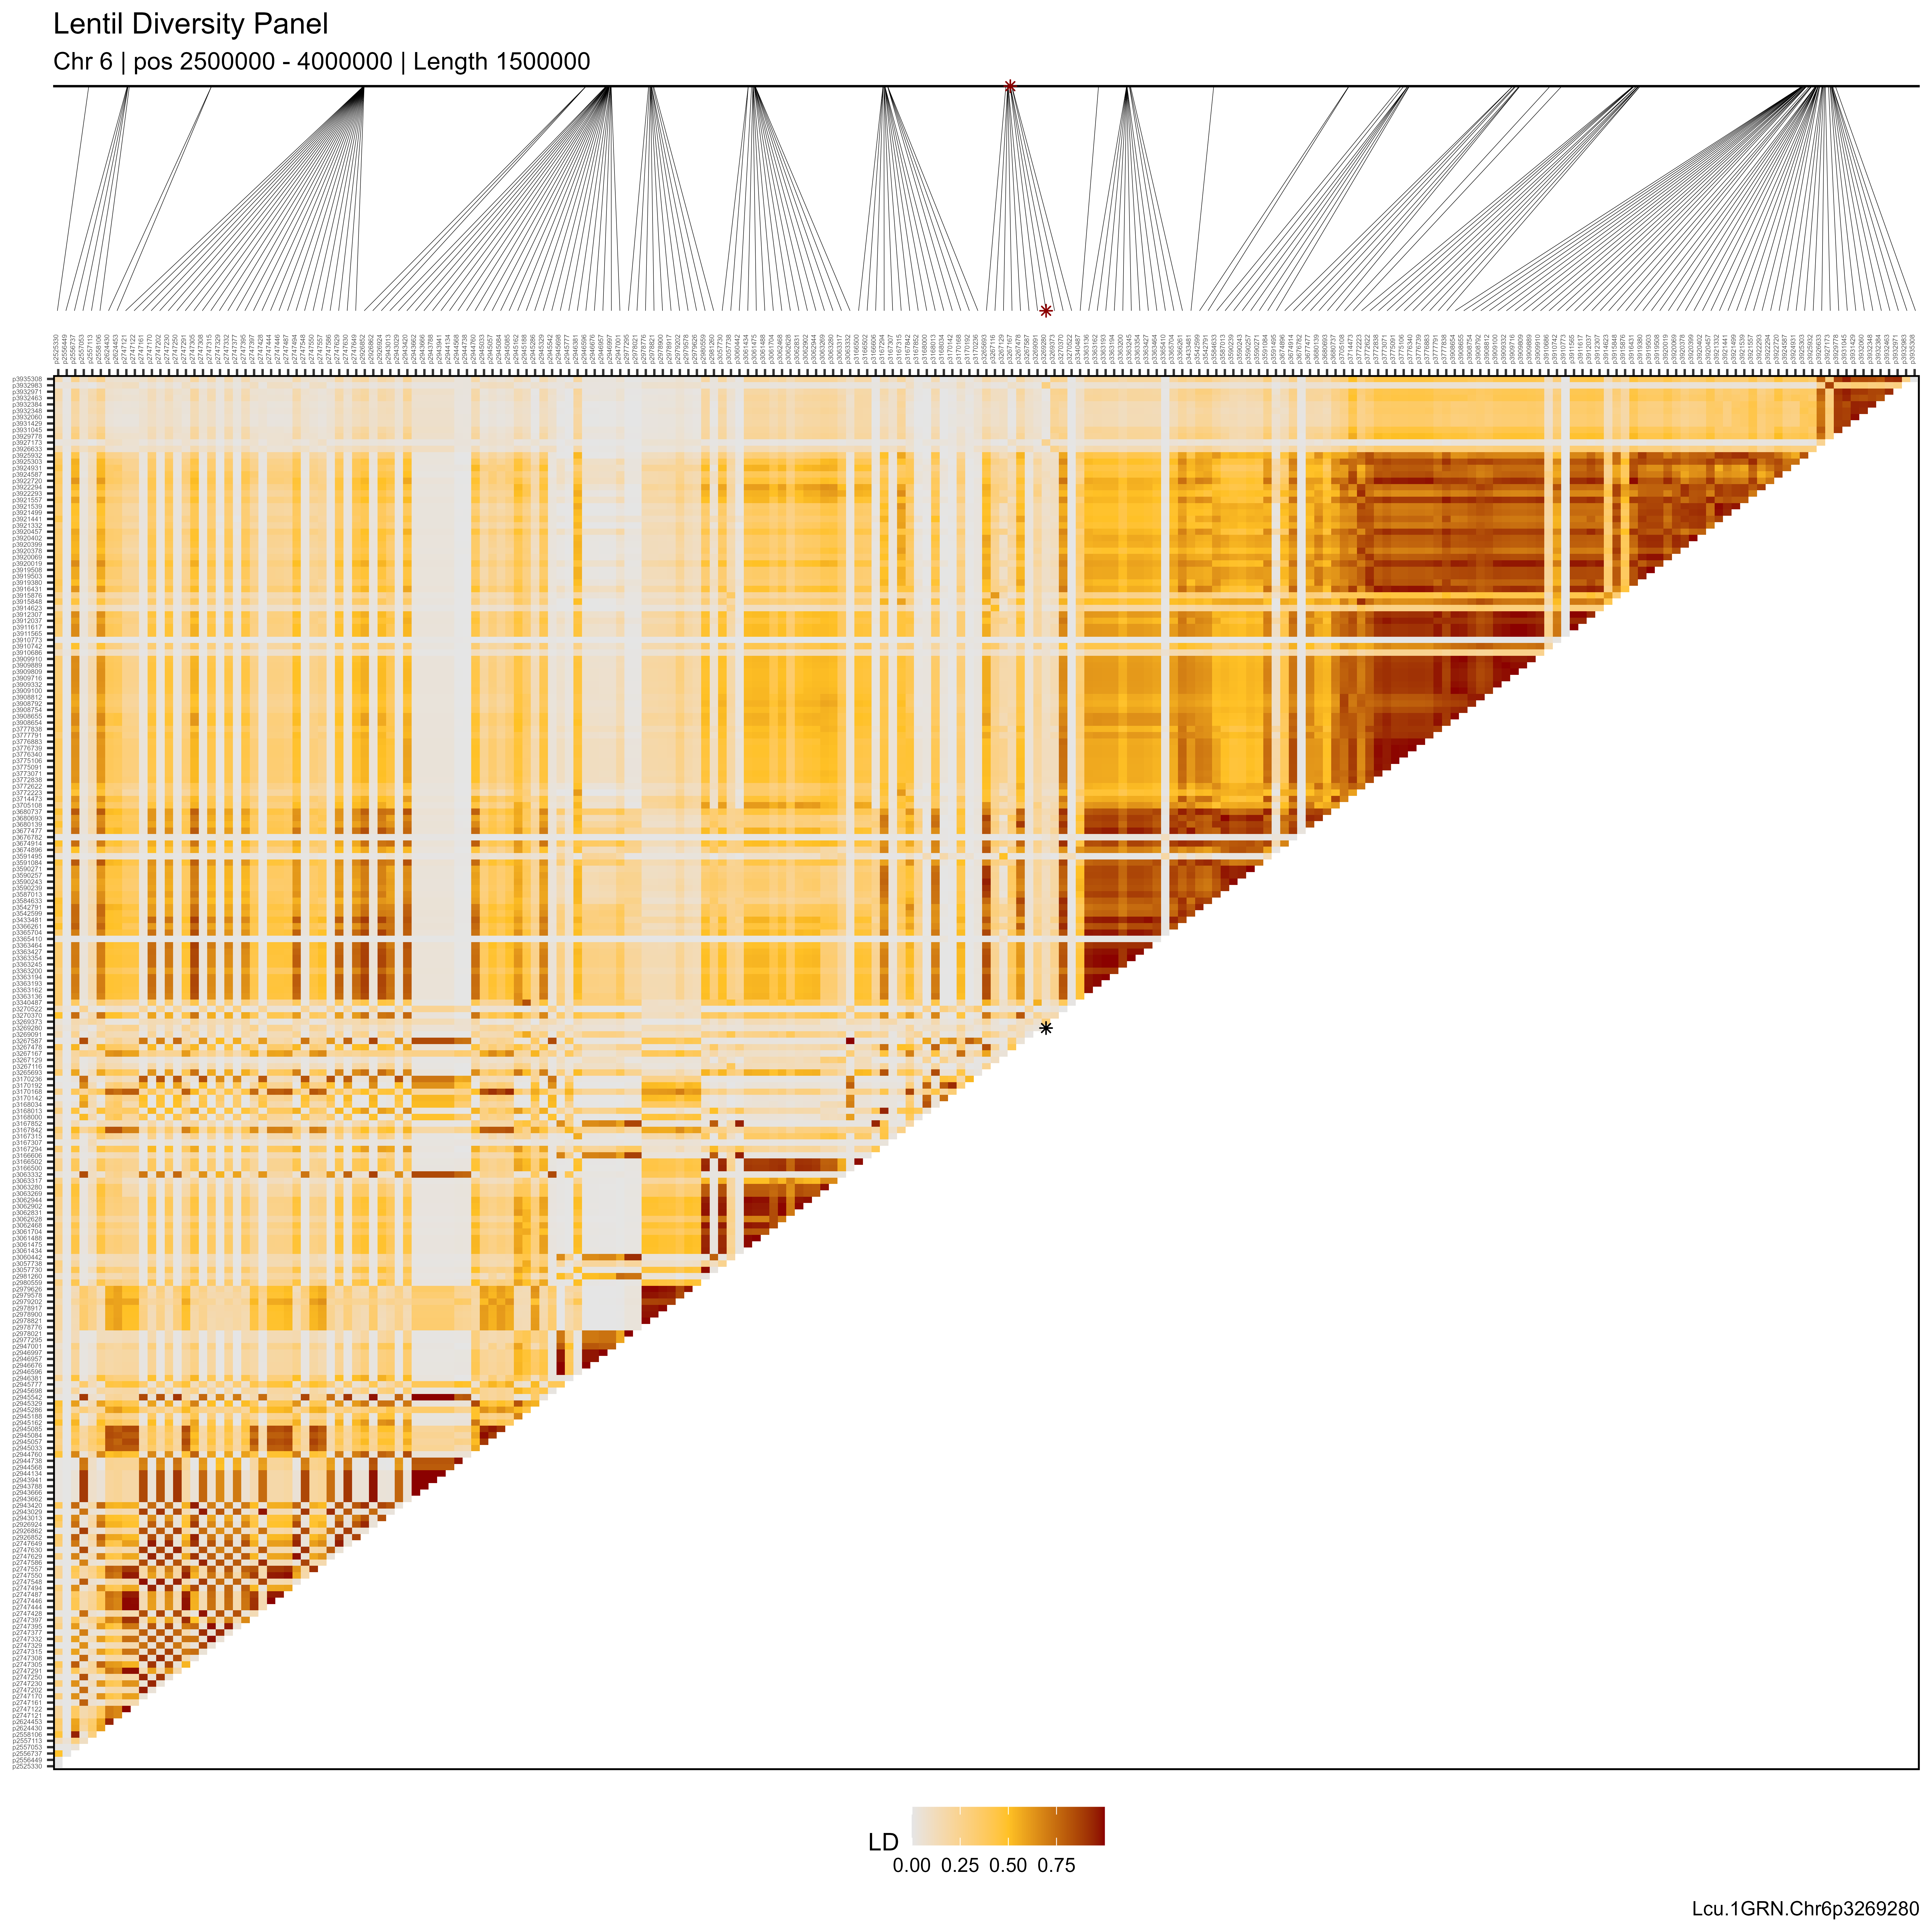
gg_LDheatmap()
4.2_gg_LDheatmap.Rmd
myG <- read.csv("myG_hmp.csv")
# Plot
mp <- gg_LDheatmap(
  xg = myG,
  chr = 6, pos1 = 2500000, pos2 = 4000000,
  myMs = "Lcu.1GRN.Chr6p3269280",
  axisTextSize = 3,
  nameTrim = "Lcu.1GRN.Chr6",
  myTitle = "Lentil Diversity Panel"
  )
# Save
ggsave("figures/gg_LDheatmap_01.png", mp, width = 12, height = 12, dpi = 600)