The function gg_GWAS_Hits() creates summary plots
showing significant association from your GWAS analyses.
# Plot
mp <- gg_GWAS_Hits(
  folder = "GWAS_Results/" )
# Save
ggsave("figures/gg_GWAS_Hits_01.png", mp, width = 12, height = 3.5)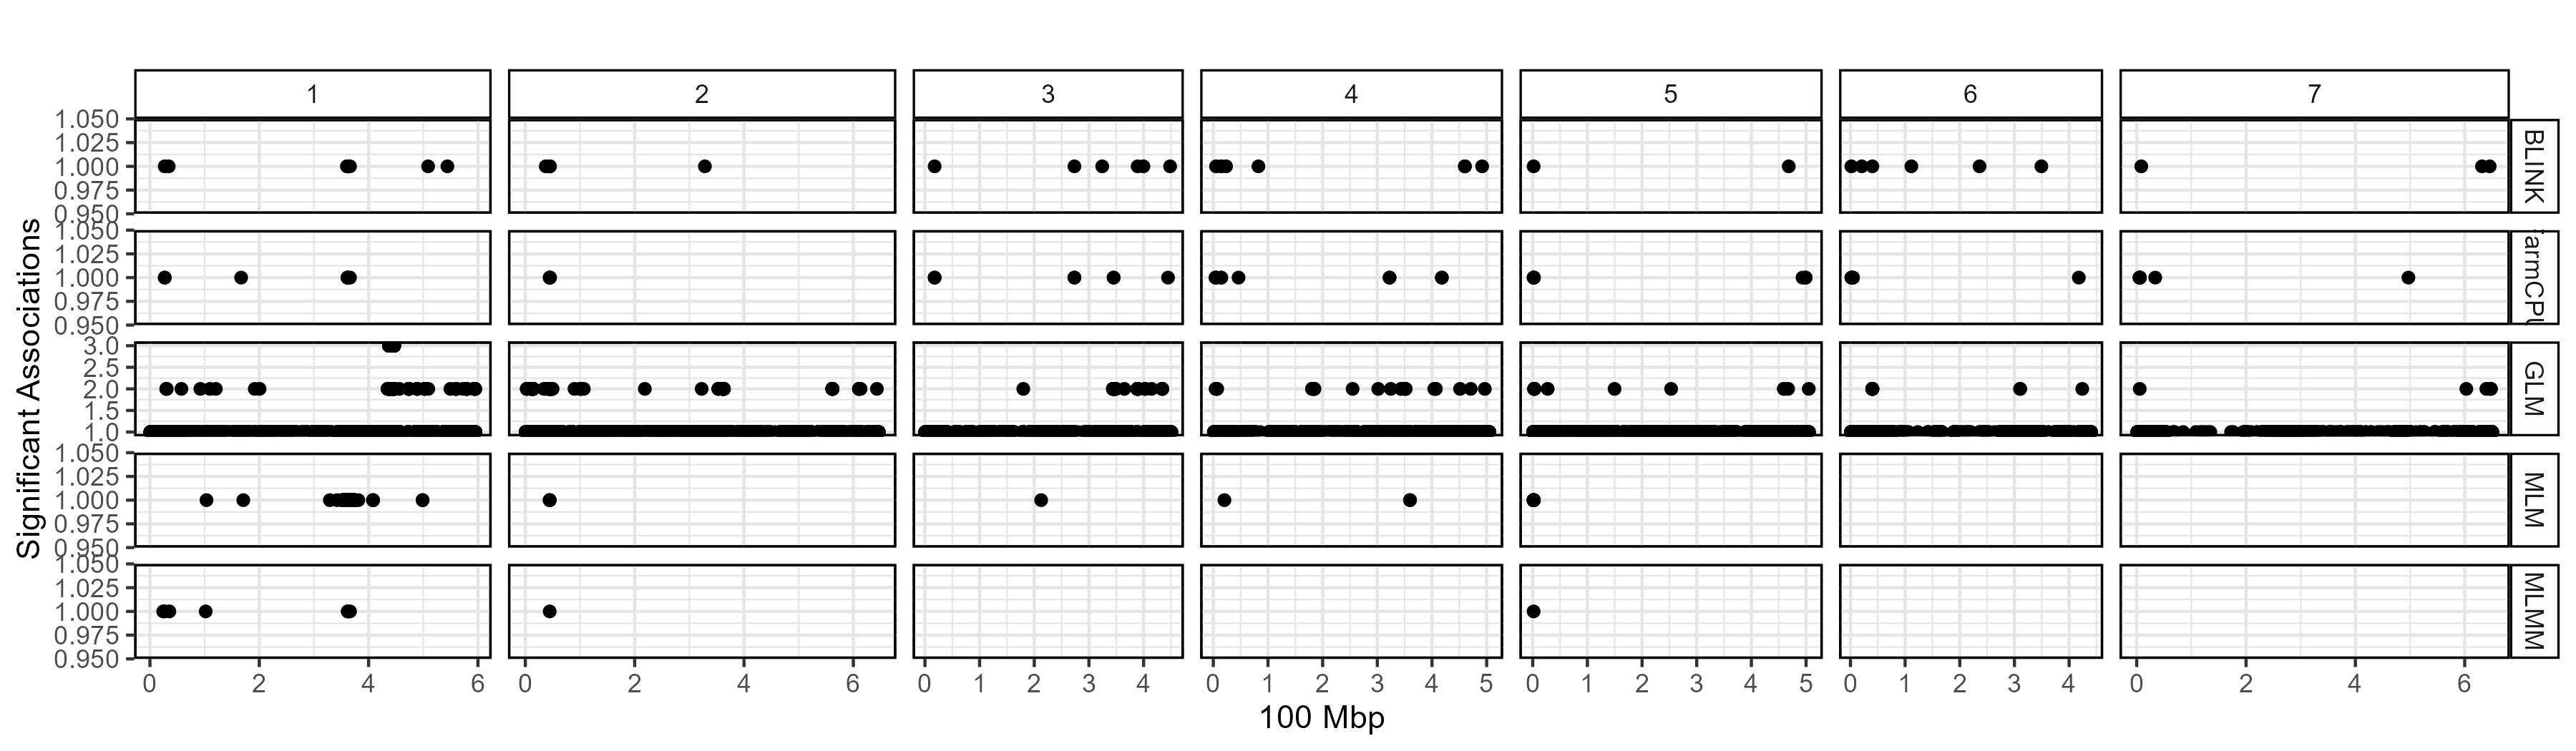
The function gg_GWAS_Hits() creates summary plots
showing significant association from your GWAS analyses.
# Plot
mp <- gg_GWAS_Hits(
folder = "GWAS_Results/" )
# Save
ggsave("figures/gg_GWAS_Hits_01.png", mp, width = 12, height = 3.5)