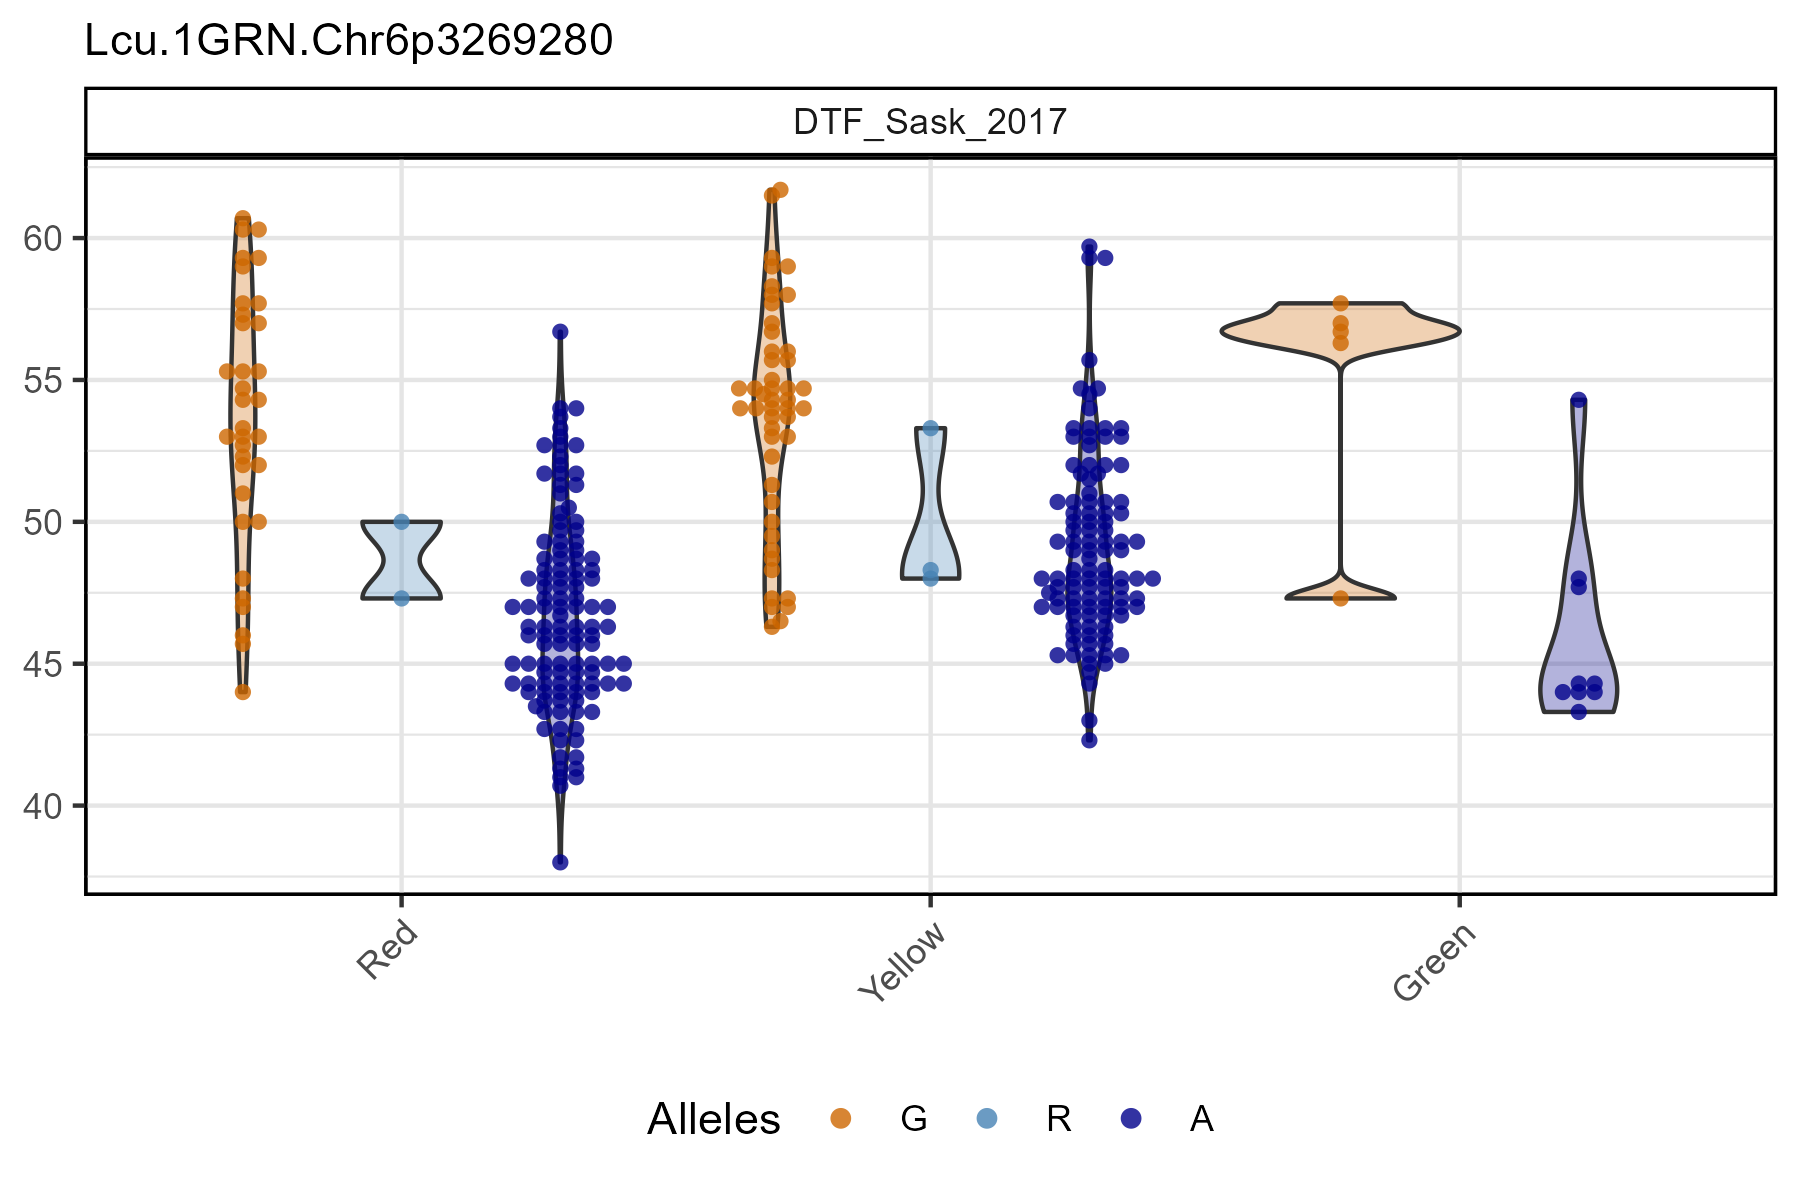
The function gg_Marker_Box() creates marker plots with
your myY and myG GWAS input files.
Load data
Note:
header = T
# Load genotype file (note: header = T)
myG <- read.csv("Data/gwaspr_myG_hmp.csv", header = T)
# Load phenotype file
myY <- read.csv("Data/gwaspr_myY.csv")
Single marker, single trait
Specifying traits and markers along with
your genotype and phenotype data as xG and xY
is needed to create marker plots.
# Plot
mp <- gg_Marker_Box(
  # Genotype data
  xG = myG,
  # Phenotype data
  xY = myY,
  # Select traits to plot
  traits = "DTF_Sask_2017",
  # Select markers to plot
  markers = "Lcu.1GRN.Chr6p3269280" )
# Save
ggsave("figures/gg_Marker_Box_01.png",
       mp, width = 6, height = 4 )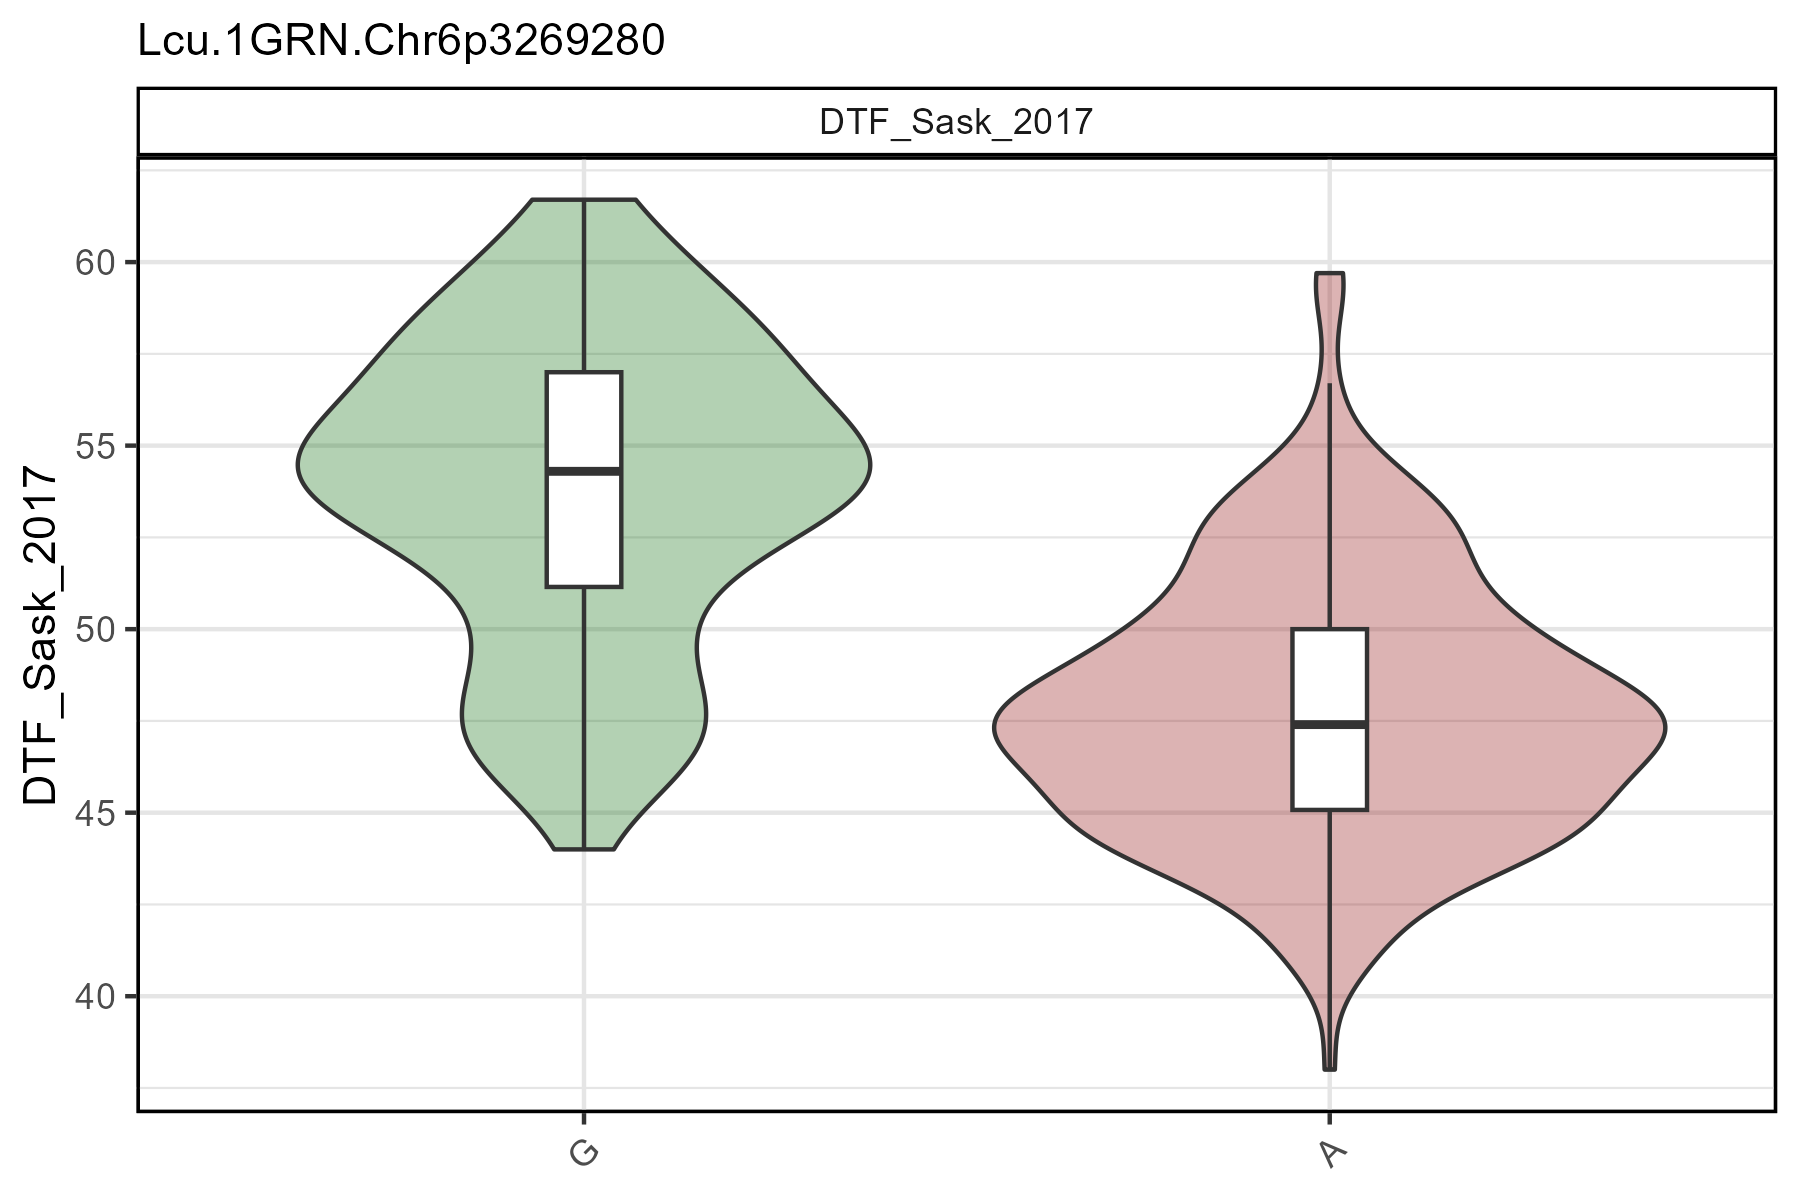
All options
gg_Marker_Bar() contains a number of different options
for customizing the marker plots.
# Prep data
markers <- c("Lcu.1GRN.Chr6p3269280")
# Plot
mp <- gg_Marker_Box(
  xG = myG,
  xY = myY,
  traits = "DTF_Sask_2017",
  markers = markers,
  marker.colors = gwaspr_Colors,
  remove.hets = F,
  remove.N = T,
  plot.violin = T,
  plot.box = T,
  plot.points = T,
  box.width = 0.1,
  point.size = 1,
  point.beeswarm = F,
  ncol = NULL,
  legend.rows = 1,
  title = NULL,
  subtitle = paste(markers, collapse = "\n"),
  cv.source = "xG",
  cv.name = NULL,
  cv.colors = NULL,
  cv.label = cv.name,
  groupByCV = F )
# Save
ggsave("figures/gg_Marker_Box_02.png",
       mp, width = 6, height = 4 )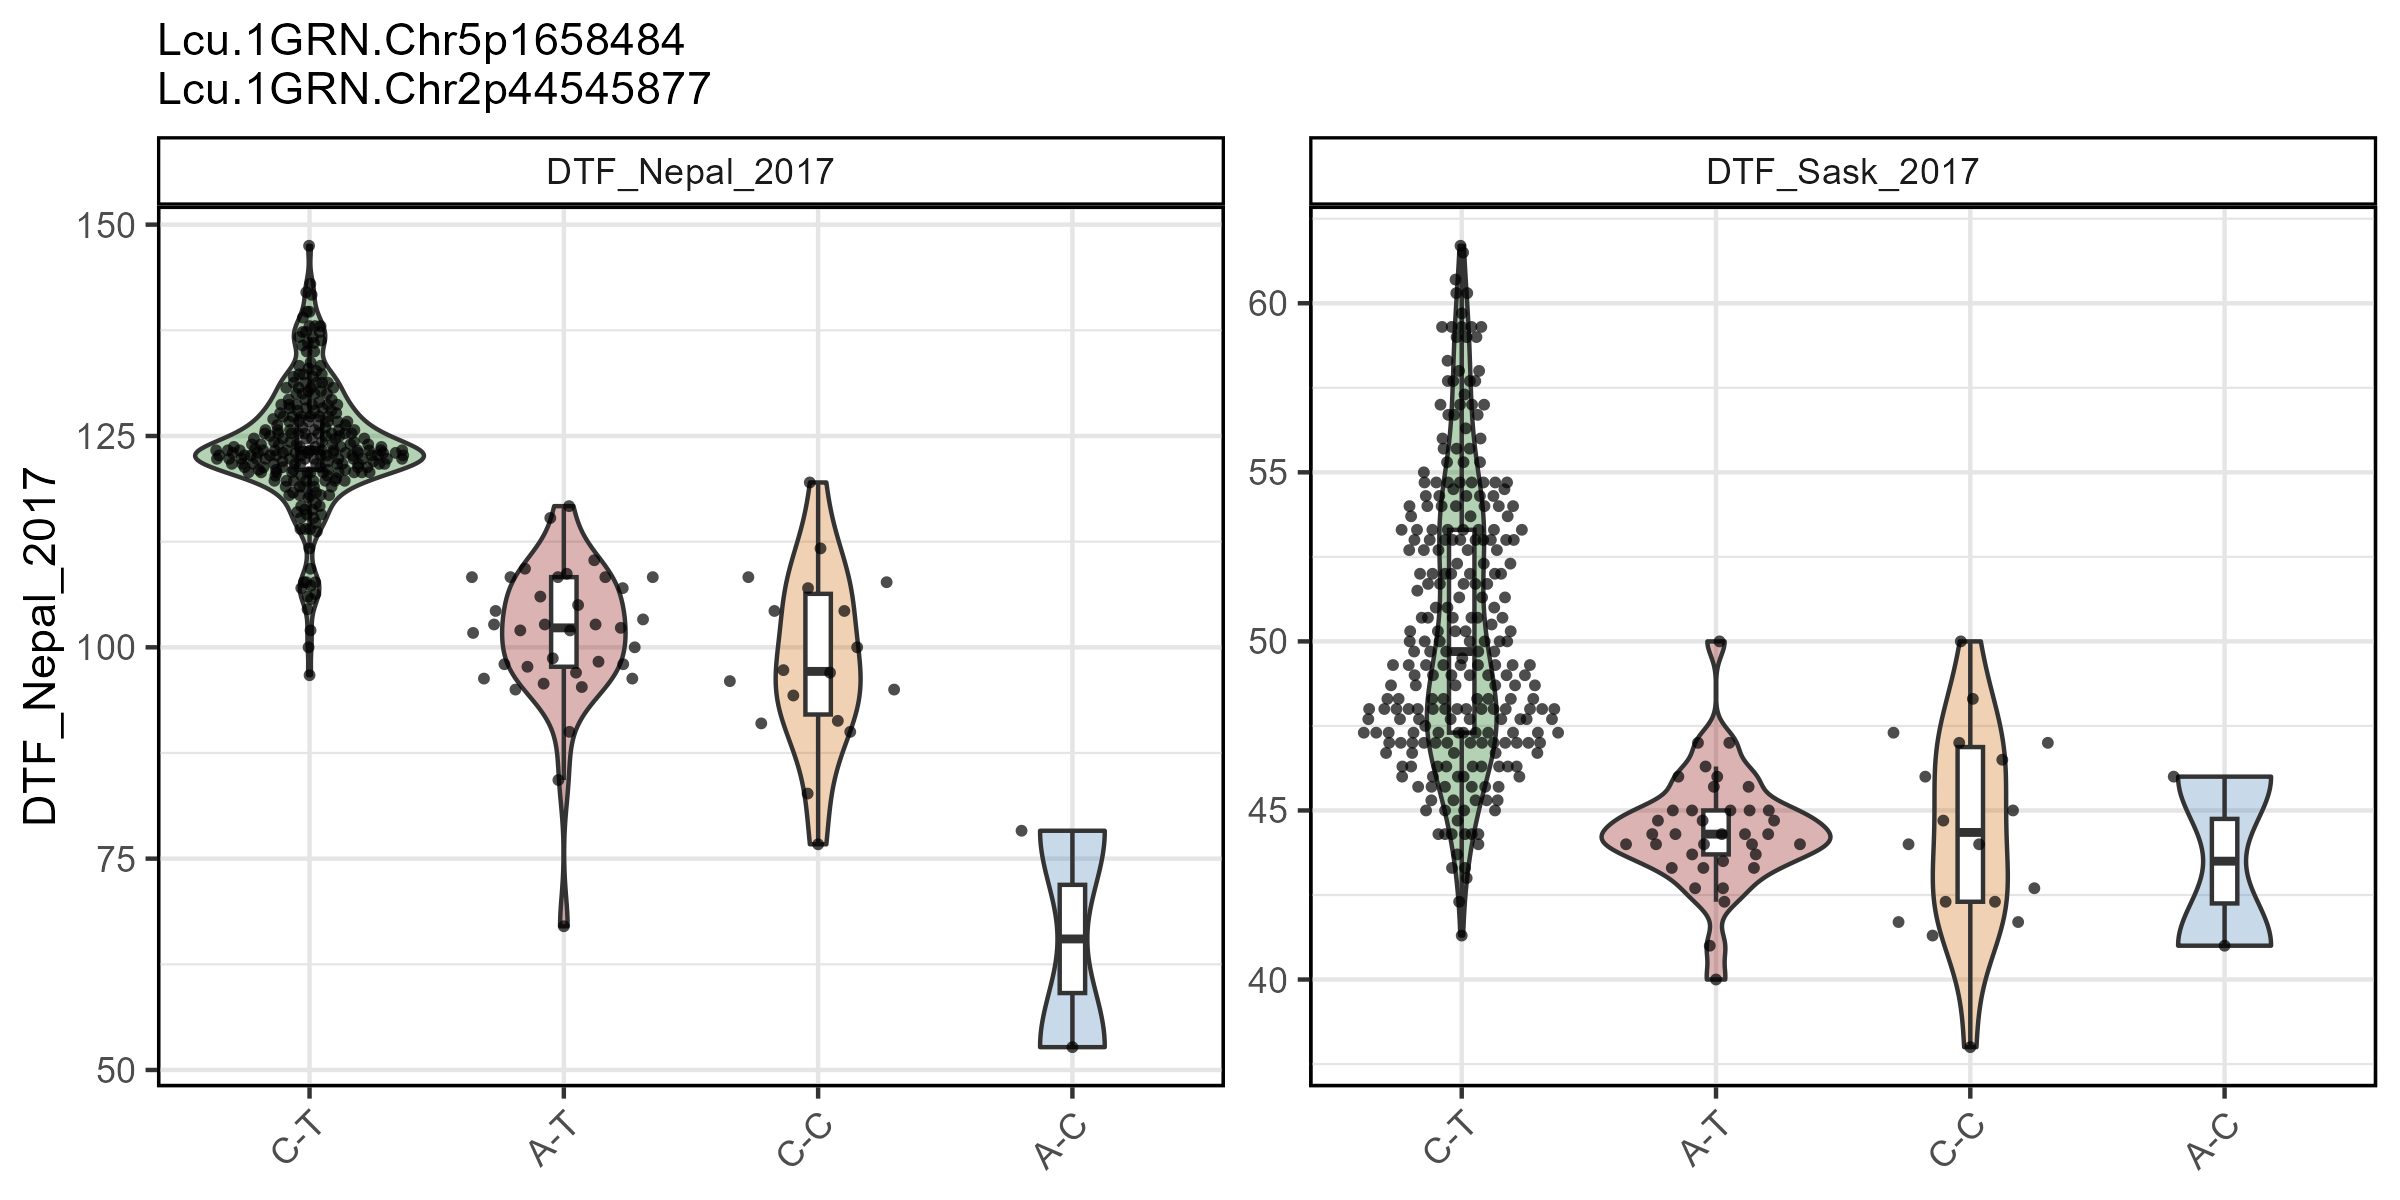
Multiple markers, multiple traits
# Plot
mp <- gg_Marker_Box(
  # Genotype data
  xG = myG,
  # Phenotype data
  xY = myY,
  # Select traits to plot
  traits = c("DTF_Nepal_2017", "DTF_Sask_2017"),
  # Select markers to plot
  markers = c("Lcu.1GRN.Chr5p1658484", "Lcu.1GRN.Chr2p44545877"),
  # Remove heterozygotic markers
  remove.hets = T )
# Save
ggsave("figures/gg_Marker_Box_03.png",
       mp, width = 8, height = 4 )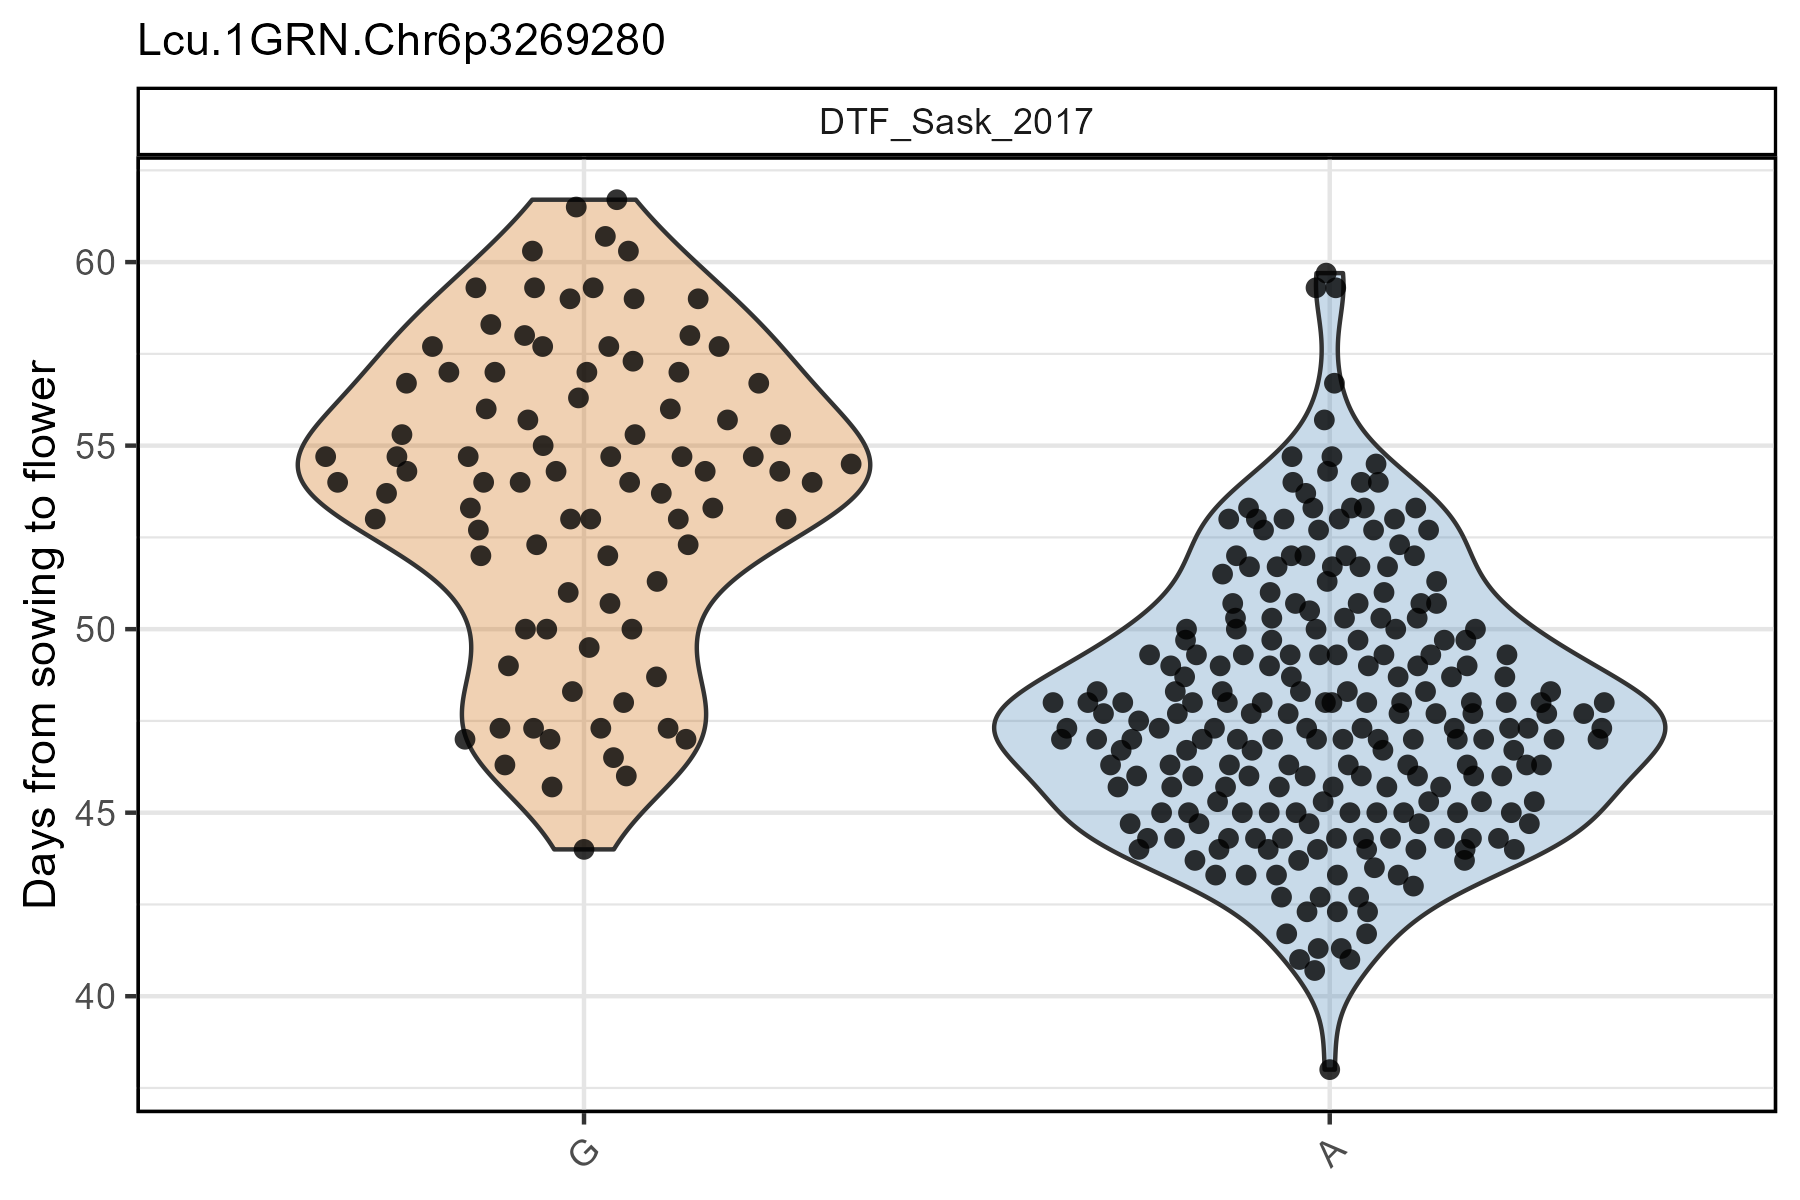
Boxplots
# Plot
mp <- gg_Marker_Box(
  # Genotype data
  xG = myG,
  # Phenotype data
  xY = myY,
  # Select traits to plot
  traits = "DTF_Sask_2017",
  # Select markers to plot
  markers = "Lcu.1GRN.Chr6p3269280",
  # Select marker colors
  marker.colors = c("darkorange3", "steelblue", "darkblue"),
  # Choose what should be plotted
  plot.violin = F,
  plot.box = T,
  plot.points = F,
  # Change the width of the boxplots
  box.width = 0.3 )
# Save
ggsave("figures/gg_Marker_Box_04.png",
       mp, width = 6, height = 4 )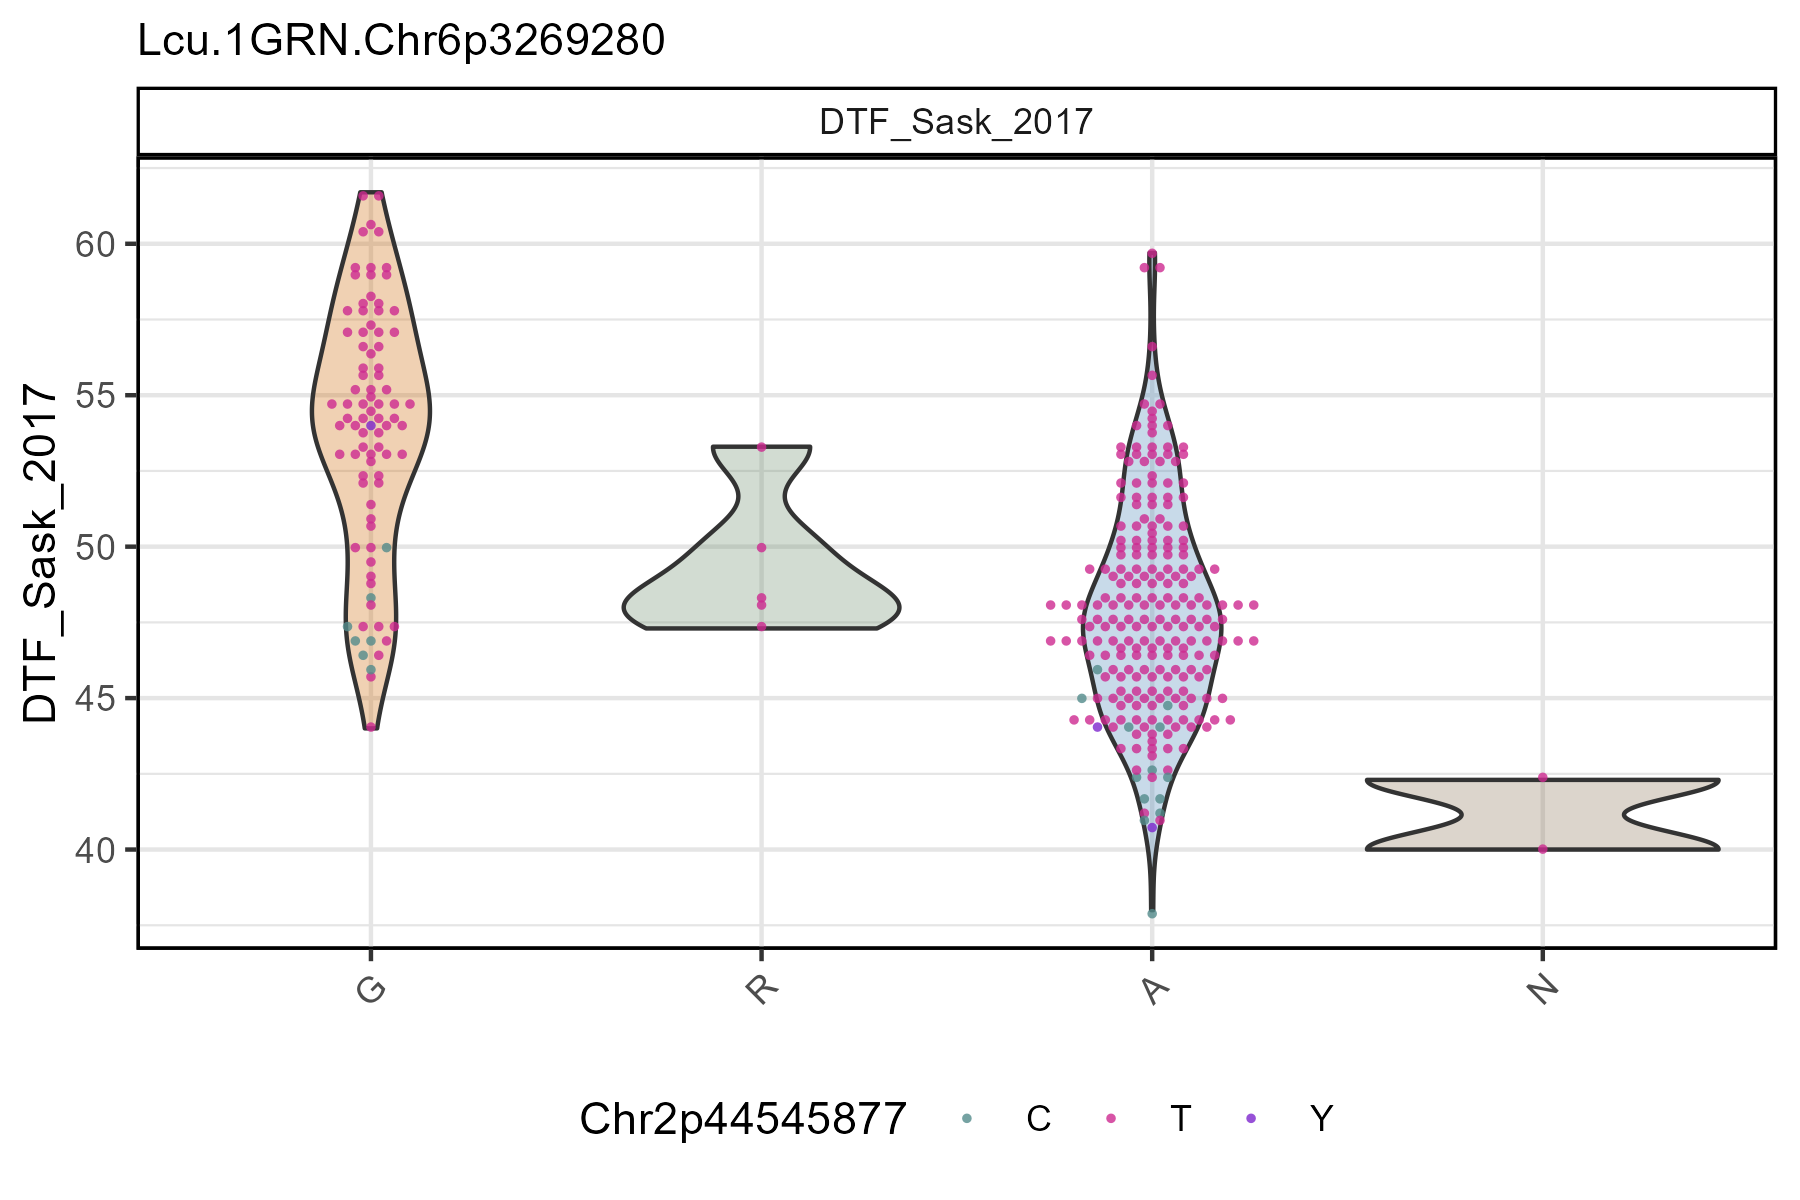
Violin + points
# Plot
mp <- gg_Marker_Box(
  # Genotype data
  xG = myG,
  # Phenotype data
  xY = myY,
  # Select traits to plot
  traits = "DTF_Sask_2017",
  # Select markers to plot
  markers = "Lcu.1GRN.Chr6p3269280",
  # Select marker colors
  marker.colors = c("darkorange3", "steelblue", "darkblue"),
  # Choose what should be plotted
  plot.violin = T,
  plot.box = F,
  plot.points = T,
  # Set the point size
  point.size = 2)
# Save
ggsave("figures/gg_Marker_Box_05.png",
       mp, width = 6, height = 4 )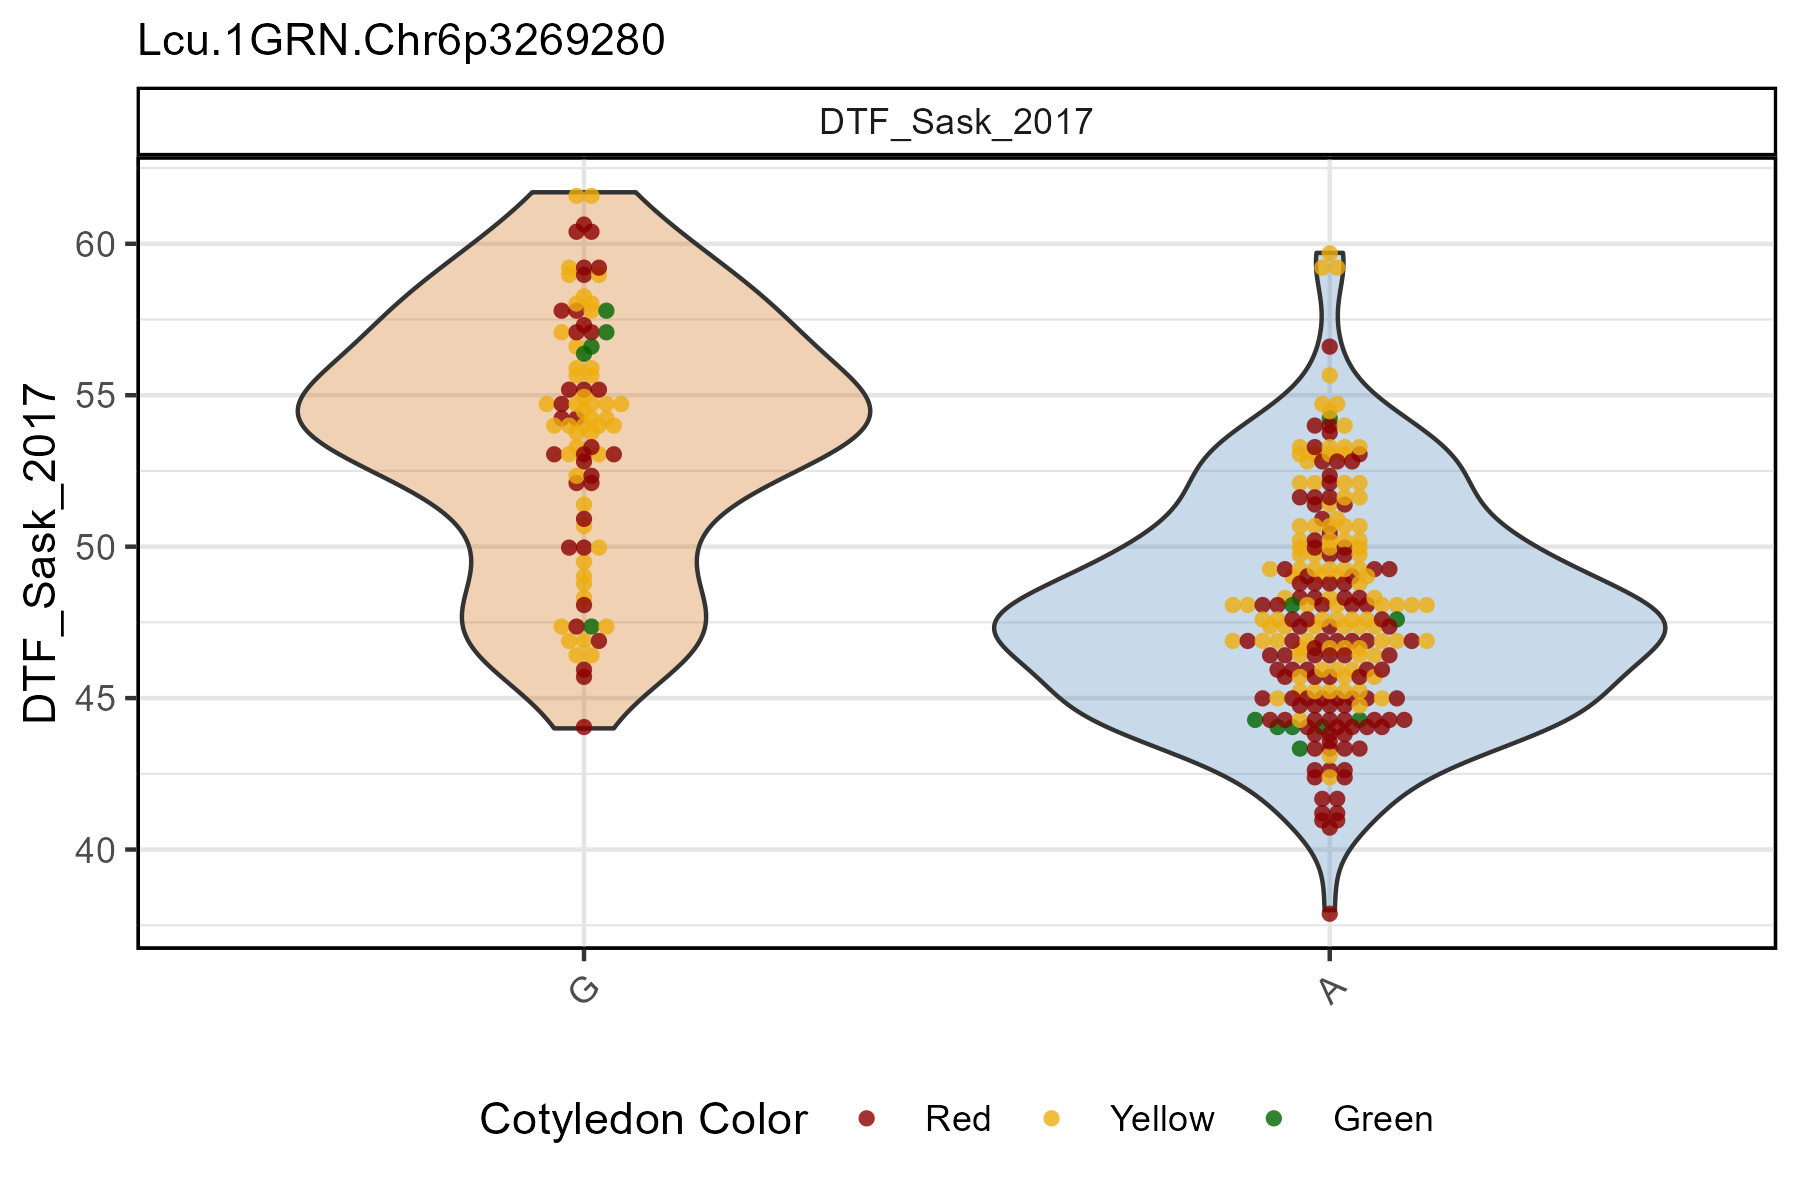
myG covariable
# Plot
mp <- gg_Marker_Box(
  # Genotype data
  xG = myG,
  # Phenotype data
  xY = myY,
  # Select traits to plot
  traits = "DTF_Sask_2017",
  # Select markers to plot
  markers = "Lcu.1GRN.Chr6p3269280",
  # Select marker colors
  marker.colors = c("burlywood4", "maroon3", "purple3"),
  # Keep heterozygous markers
  remove.hets = F,
  # Choose what should be plotted
  plot.violin = T,
  plot.box = F,
  plot.points = T,
  # Set the point size
  point.size = 0.75,
  # Plot with geom_beeswarm instead of quasirandom
  point.beeswarm = T,
  # Select Covariable trait for points
  cv.name = "Lcu.1GRN.Chr2p44545877",
  # Select colors for the covariable
  cv.colors = c("darkorange3", "steelblue", "darkblue") )
# Save
ggsave("figures/gg_Marker_Box_06.png",
       mp, width = 6, height = 4 )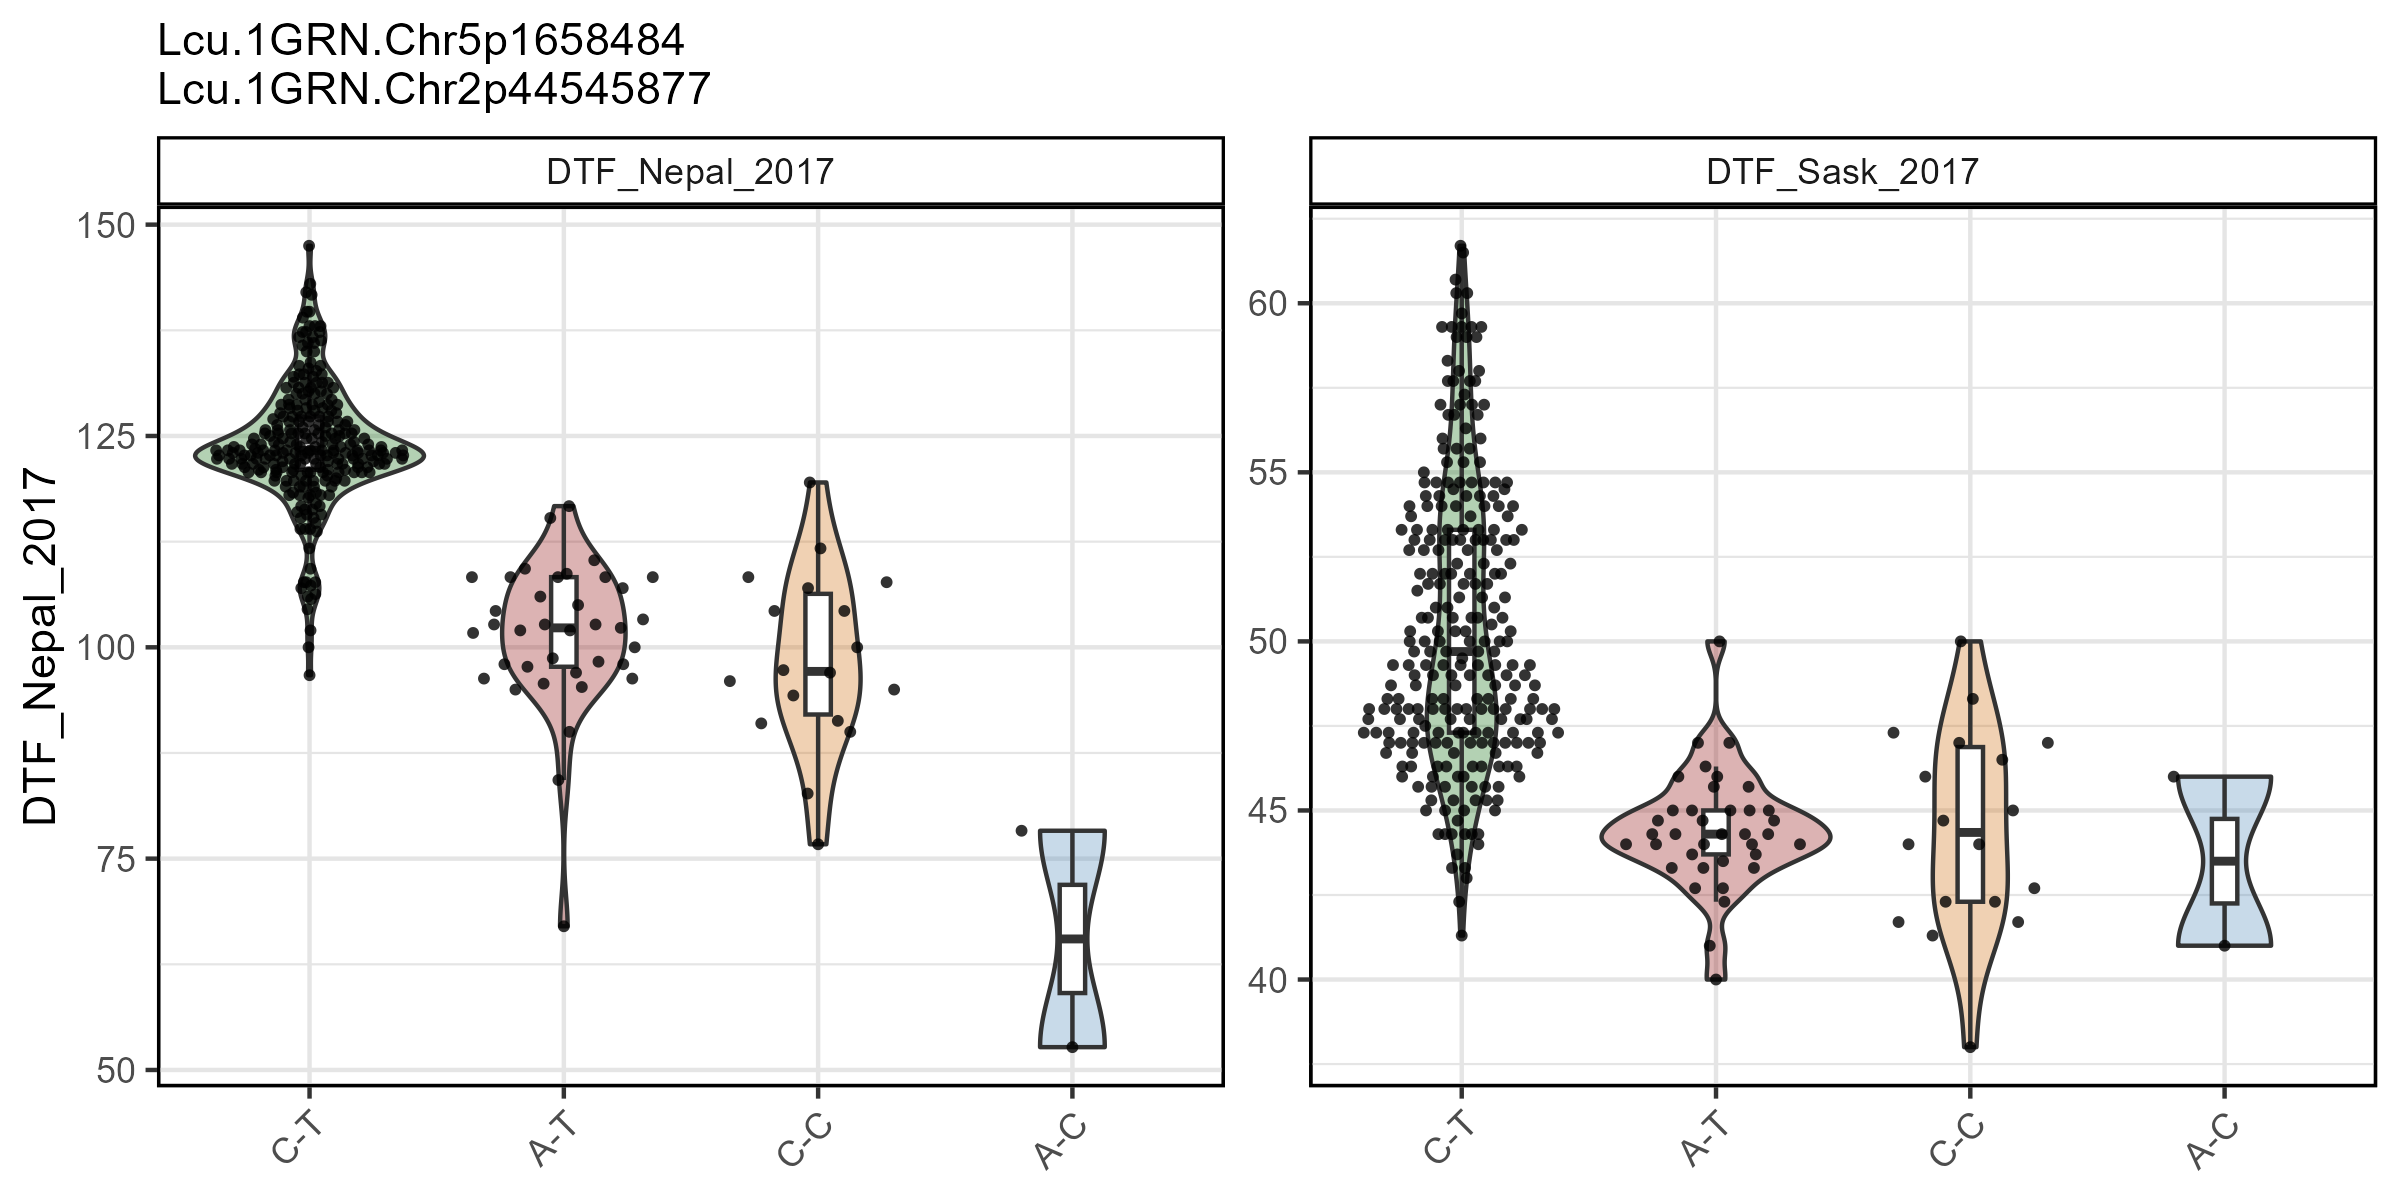
myY covariable
# Plot
mp <- gg_Marker_Box(
  # Genotype data
  xG = myG,
  # Phenotype data
  xY = myY,
  # Select traits to plot
  traits = "DTF_Sask_2017",
  # Select markers to plot
  markers = "Lcu.1GRN.Chr6p3269280",
  # Select marker colors
  marker.colors = c("darkorange3", "steelblue", "darkblue"),
  # Choose what should be plotted
  plot.violin = T,
  plot.box = F,
  plot.points = T,
  # Set the point size
  point.size = 1.5,
  # Plot with geom_beeswarm instead of quasirandom
  point.beeswarm = T,
  # Select covariable source
  cv.source = "xY",
  # Select Covariable trait for points
  cv.name = "Cotyledon_Color",
  # Select colors for the covariable
  cv.colors = c("darkred", "darkgoldenrod2", "darkgreen", "grey"),
  # Set a custom label for the covariable legend
  cv.label = "Cotyledon Color" )
# Save
ggsave("figures/gg_Marker_Box_07.png",
       mp, width = 6, height = 4 )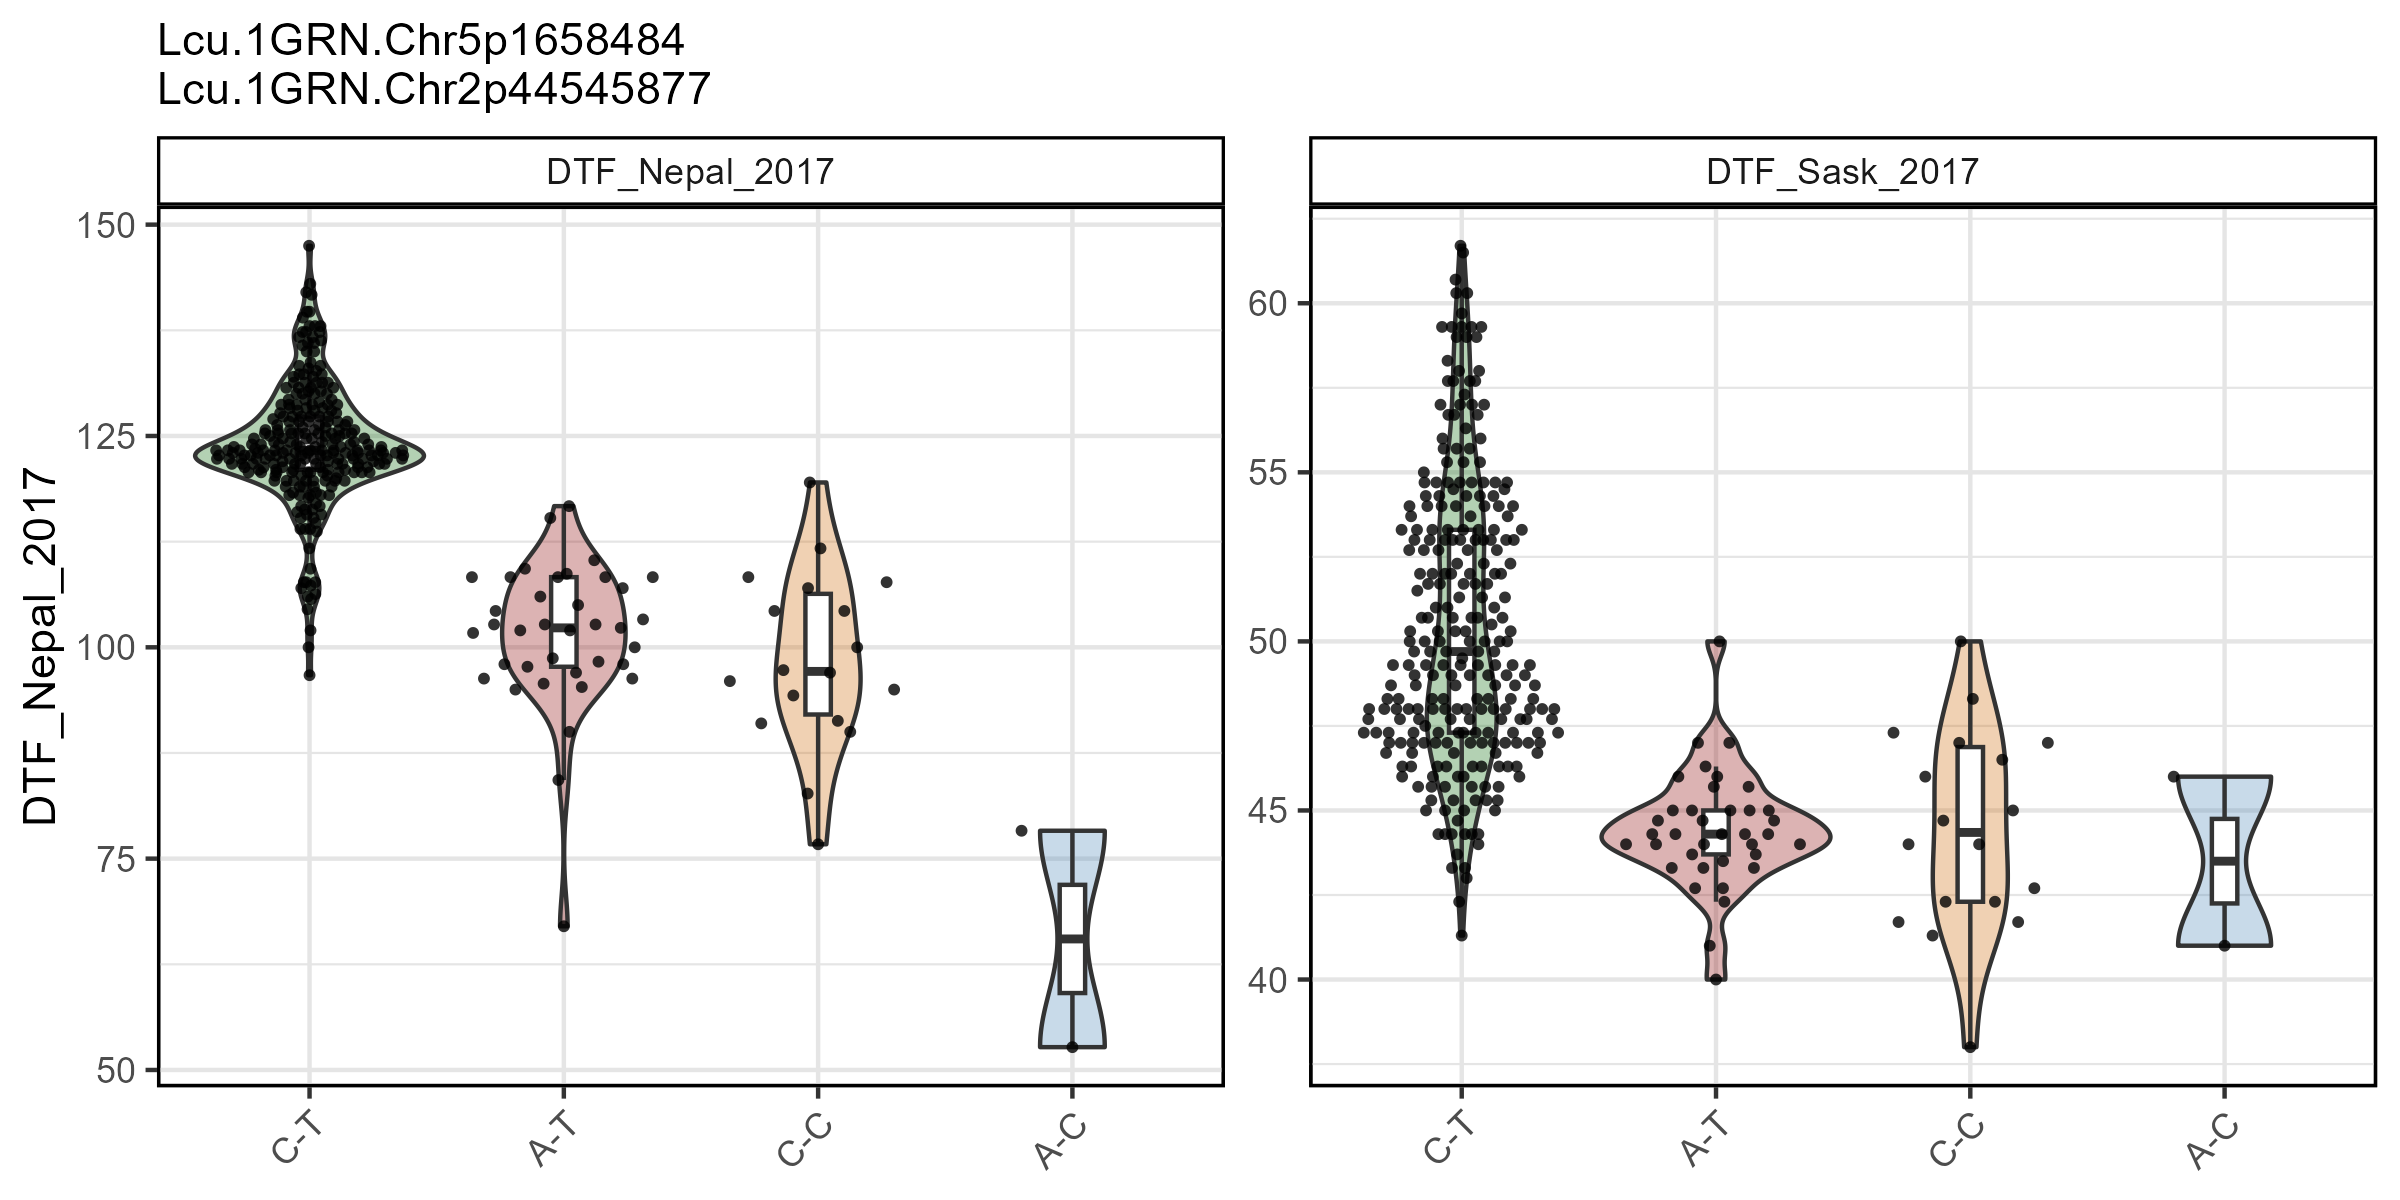
Grouped by myY covariable
# Plot
mp <- gg_Marker_Box(
  # Genotype data
  xG = myG,
  # Phenotype data
  xY = myY,
  # Select traits to plot
  traits = "DTF_Sask_2017",
  # Select markers to plot
  markers = "Lcu.1GRN.Chr6p3269280",
  # Select marker colors
  marker.colors = c("darkorange3", "steelblue", "darkblue"),
  # Choose what should be plotted
  plot.violin = T,
  plot.box = F,
  plot.points = T,
  # Set the point size
  point.size = 1.5,
  # Plot with geom_beeswarm instead of quasirandom
  point.beeswarm = T,
  # Select covariable source
  cv.source = "xY",
  # Select Covariable trait for points
  cv.name = "Cotyledon_Color",
  # Select colors for the covariable
  cv.colors = c("darkred", "darkgoldenrod2", "darkgreen", "grey"),
  # Set a custom label for the covariable legend
  cv.label = "Cotyledon Color",
  # Plot CV on x-axis instead of marker
  groupByCV = T)
# Save
ggsave("figures/gg_Marker_Box_08.png",
       mp, width = 6, height = 4 )