GAPIT
checkNYCvsKansas()
The function checkNYCvsKansas() will output a table
indicating the number of markers with different p values between NYC and
Kansas files.
Specifying a folder of GWAS results is all that is
needed for this function.
checkNYCvsKansas(
  # Specify a folder with GWAS results
  folder = "GWAS_Results/",
  # Delete any Kansas files with no difference between the NYC files if set to T
  deleteKansas = F )
## Trait FarmCPU BLINK
## 1 Cotyledon_RedvsYellow 76 1
## 2 DTF_Nepal_2017 731 0
## 3 DTF_Sask_2017 584 0
## 4 DTF_Sask_2017_b 543 0gg_NYCvsKansas()
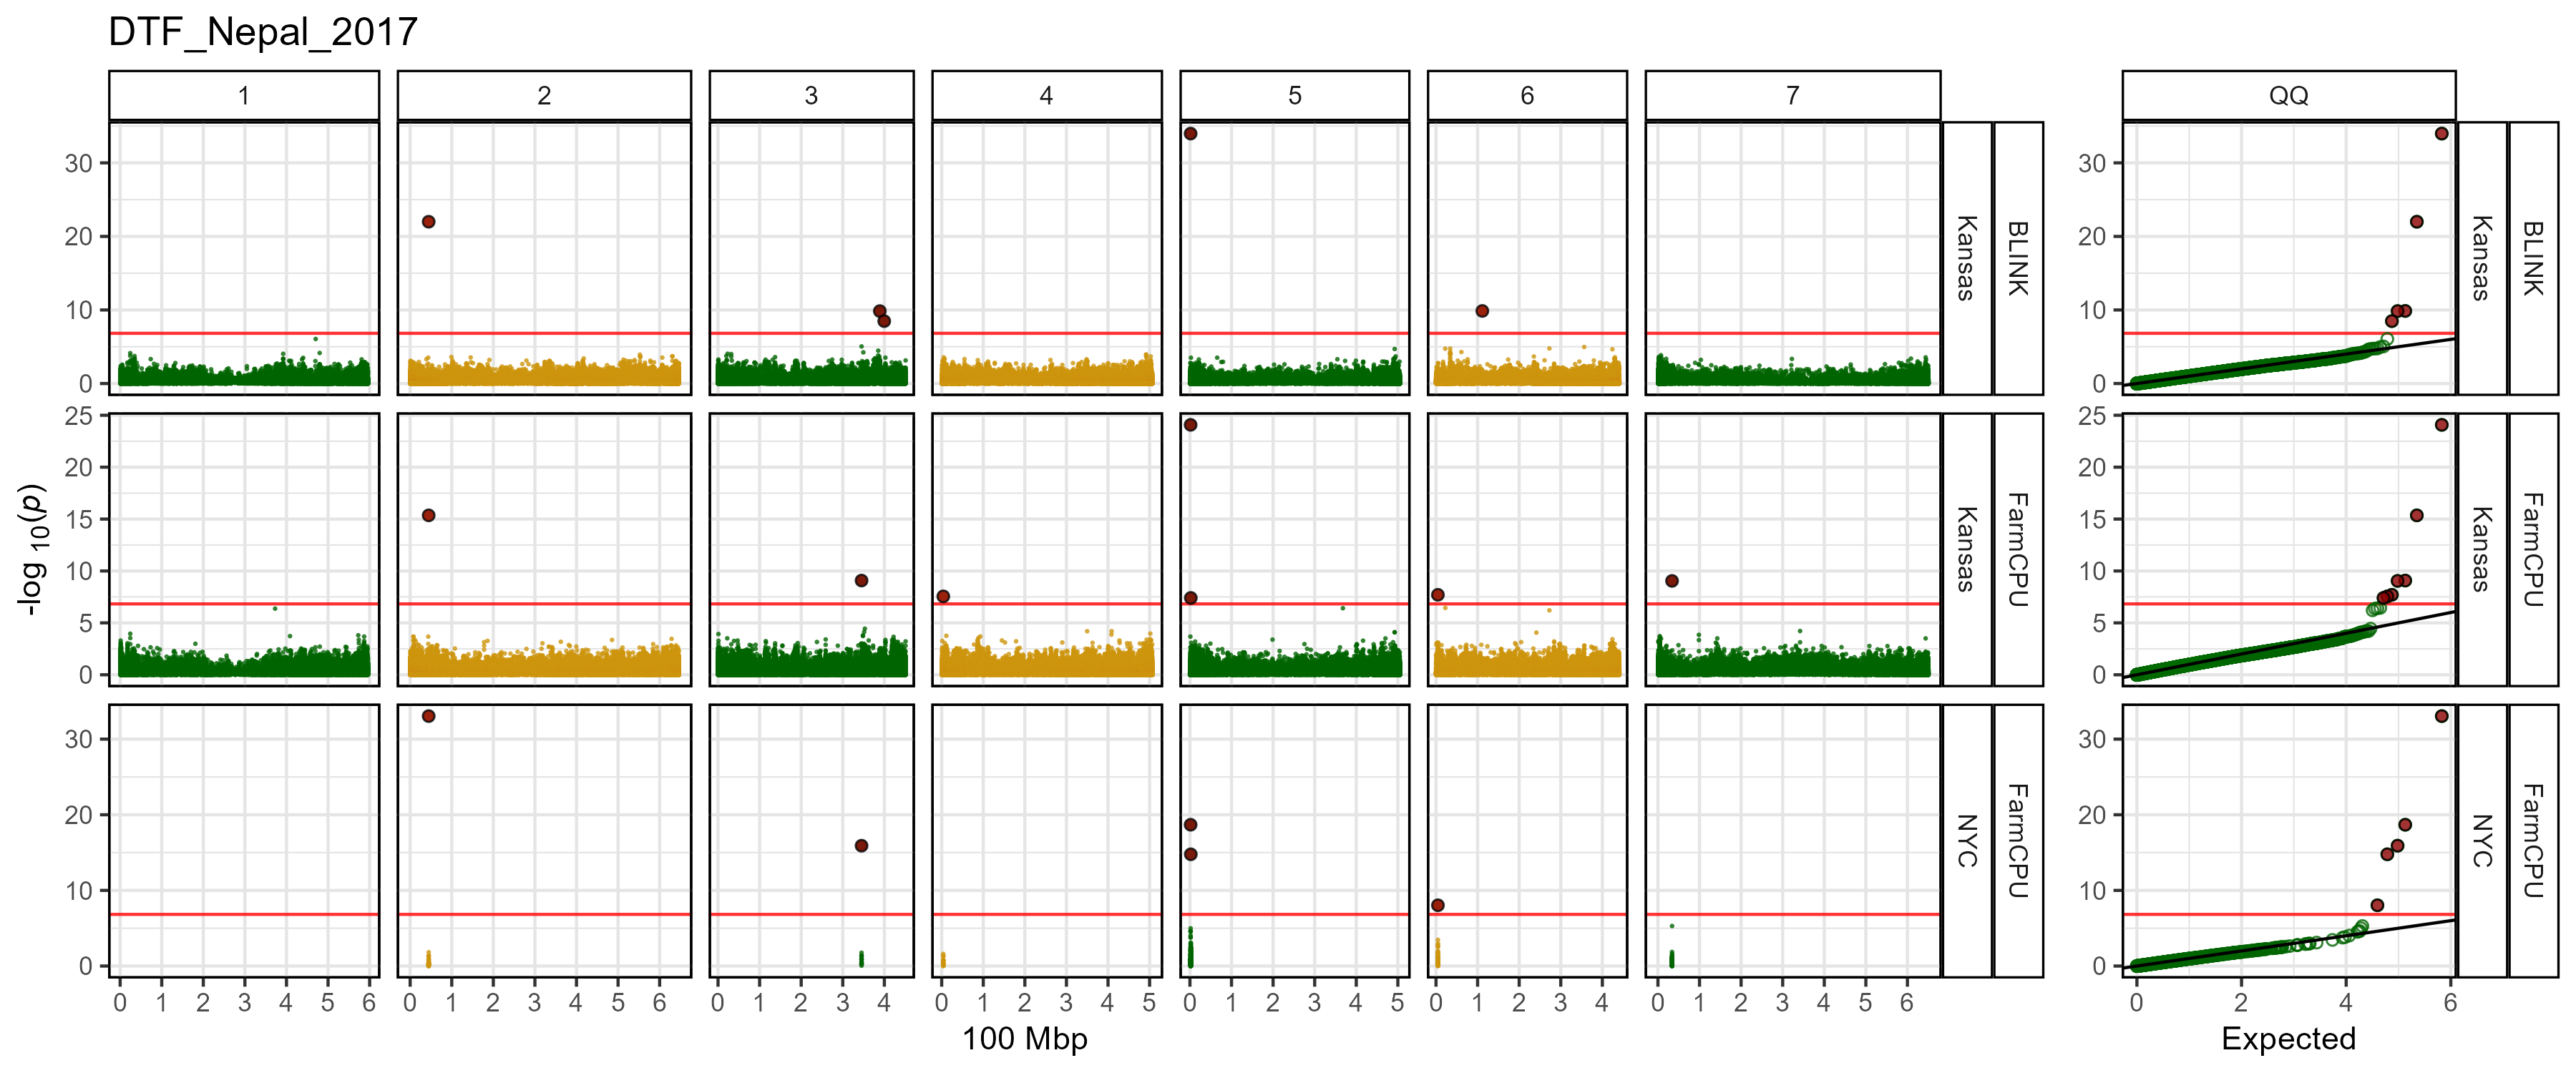
The function gg_NYCvsKansas() creates manhattan plots
from GAPIT GWAS results.
Specifying a folder and trait is all that
is needed to create manhattan plots.
mp <- gg_NYCvsKansas(
  # Specify a folder with GWAS results
  folder = "GWAS_Results/",
  # Specify a trait to plot
  trait = "DTF_Nepal_2017"
)
# Save
ggsave("figures/gg_NYCvsKansas.png", mp, width = 12, height = 5)